I was walking through the hardware store the other day and I walked past an energy meter which clips onto your home’s electricity mains and then provides you with information on your power consumption and cost estimates for the month. I thought it looked really cool until I saw the price, it was almost five times what I thought it would be! So I decided to try and build my own and Arduino was the perfect platform for it.
I had a look around online at what others had done but they all seemed to be a bit over complicated for a simple home application. Sure, for perfectly accurate measurements you need to monitor both the supply voltage and current but for simple household monitoring which gives estimates cost to the closest few cents, why not keep things simple.
So this meter measures the supply current to your home through a CT (current transformer) and then does a couple of calculations to give you your current, power, maximum power and kilowatt hours consumed. Its also really easy to add your local tariff and display the cost of electricity used to date.
Update: Follow this guide is if you are wanting to build a 3 phase energy meter.
This project assumes you know the basics of Arduino programming, otherwise read our article on getting started with Arduino, and that you know how to connect an LCD screen to an Arduino.
What You Will Need For A Home Energy Meter
- An Arduino (Uno used in this guide) – Buy Here
- LCD Shield (Or LCD Screen – how to connect an LCD screen) – Buy Here
- CT – Talema AC1030 (See below for different options and purchase links)
- 56Ω Burden Resistor – Buy Here
- 10µF Capacitor – Buy Here
- 2 x 100K Divider Resistors – Buy Here
How To Make The Energy Meter
First you need to start by assembling the components onto the CT or onto your breadboard in order to create your current sensor which produces a signal which your Arduino can understand. An Arduino only has analogue voltage inputs which measure 0-5V DC, so you need to convert the current output from the CT into a voltage reference and then scale the voltage reference into a 0-5V range.
Assemble the Components
If you are going to be installing your power meter somewhere permanently then you may want to solder the resistors and capacitor directly onto the CT so that they cannot come loose. If you are simply trying this project for fun then a breadboard is perfect.
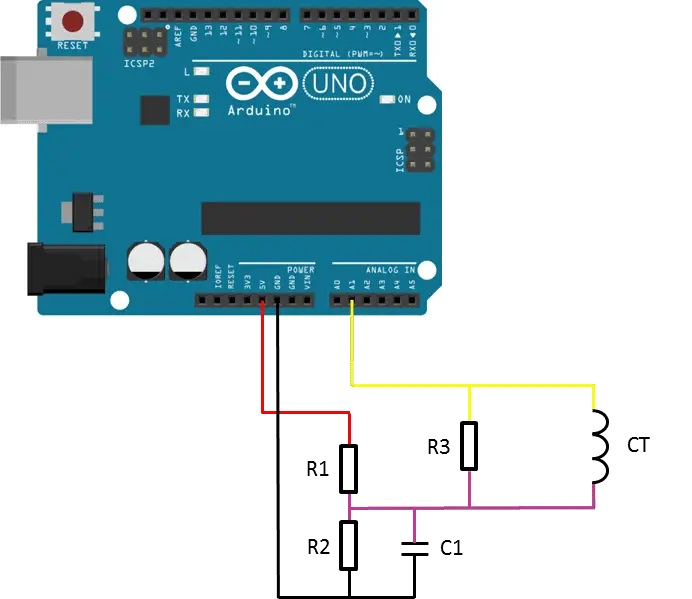
The basic circuit for the connection of the CT to the Arduino is shown in the diagram below:
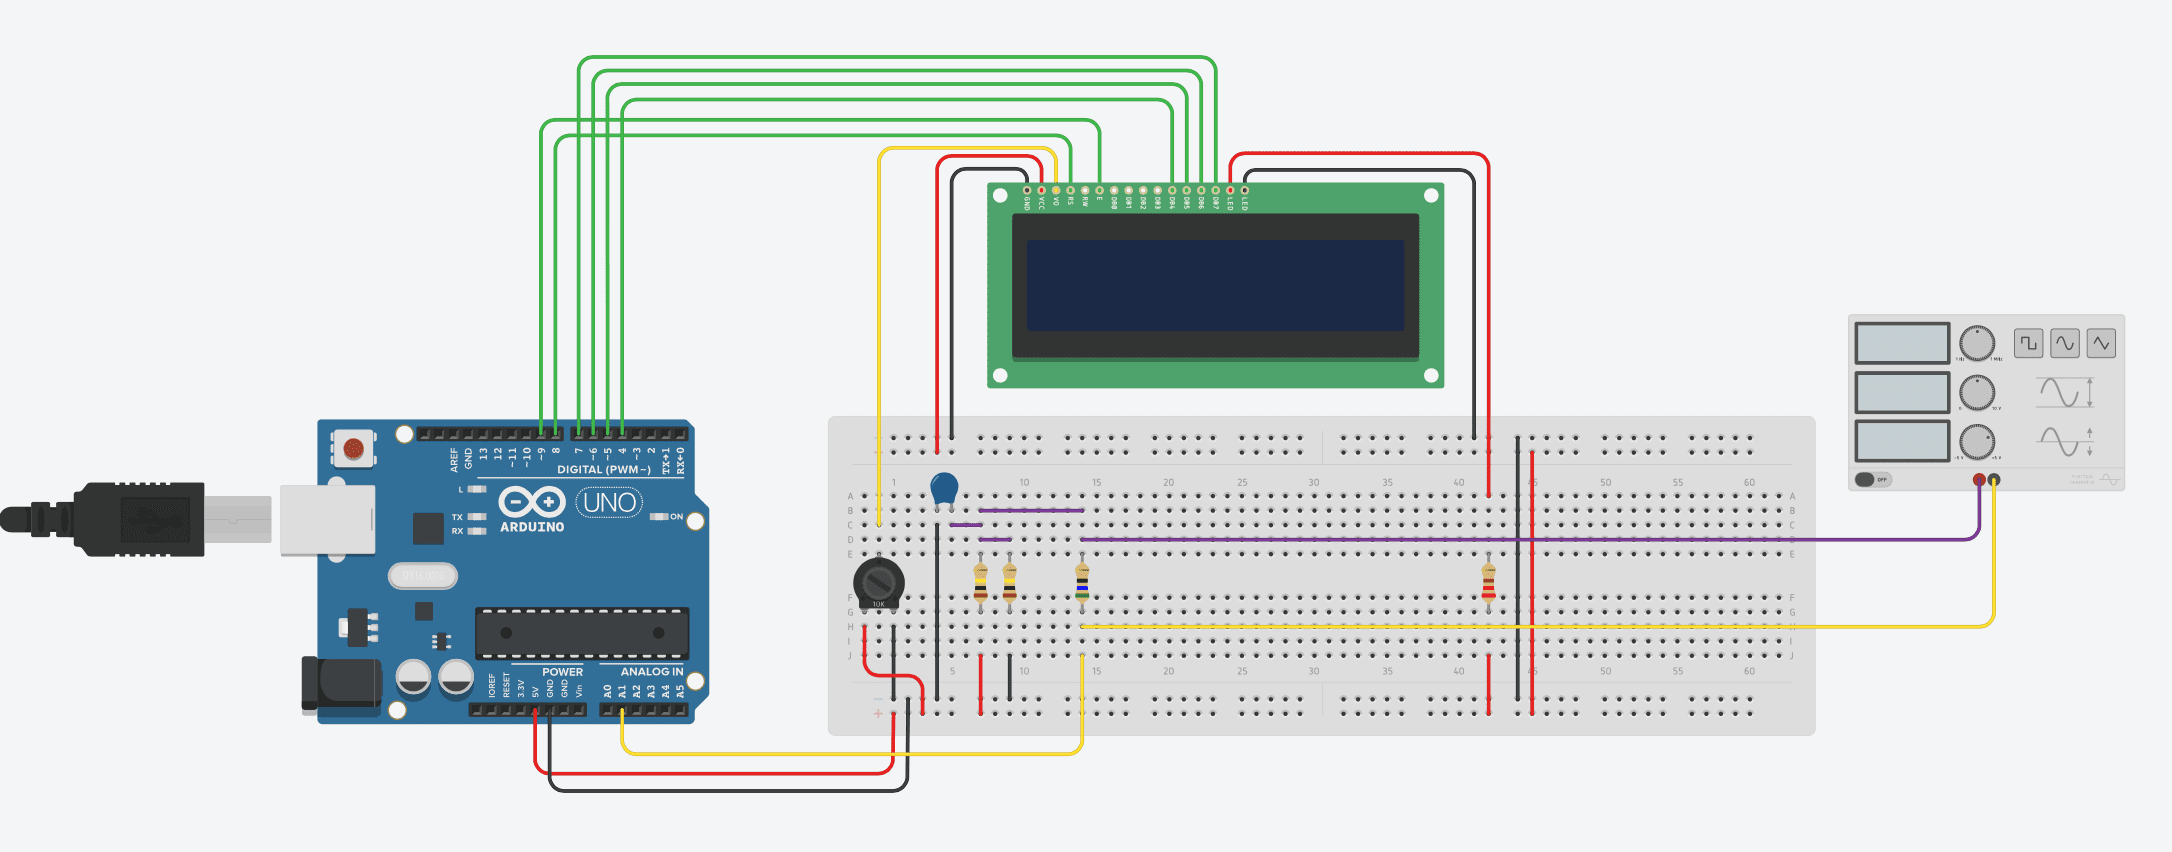
A breadboard circuit layout is shown below. Please note that TinkerCAD doesn’t support a current transformer. A signal generator has therefore been used to generate an example signal:
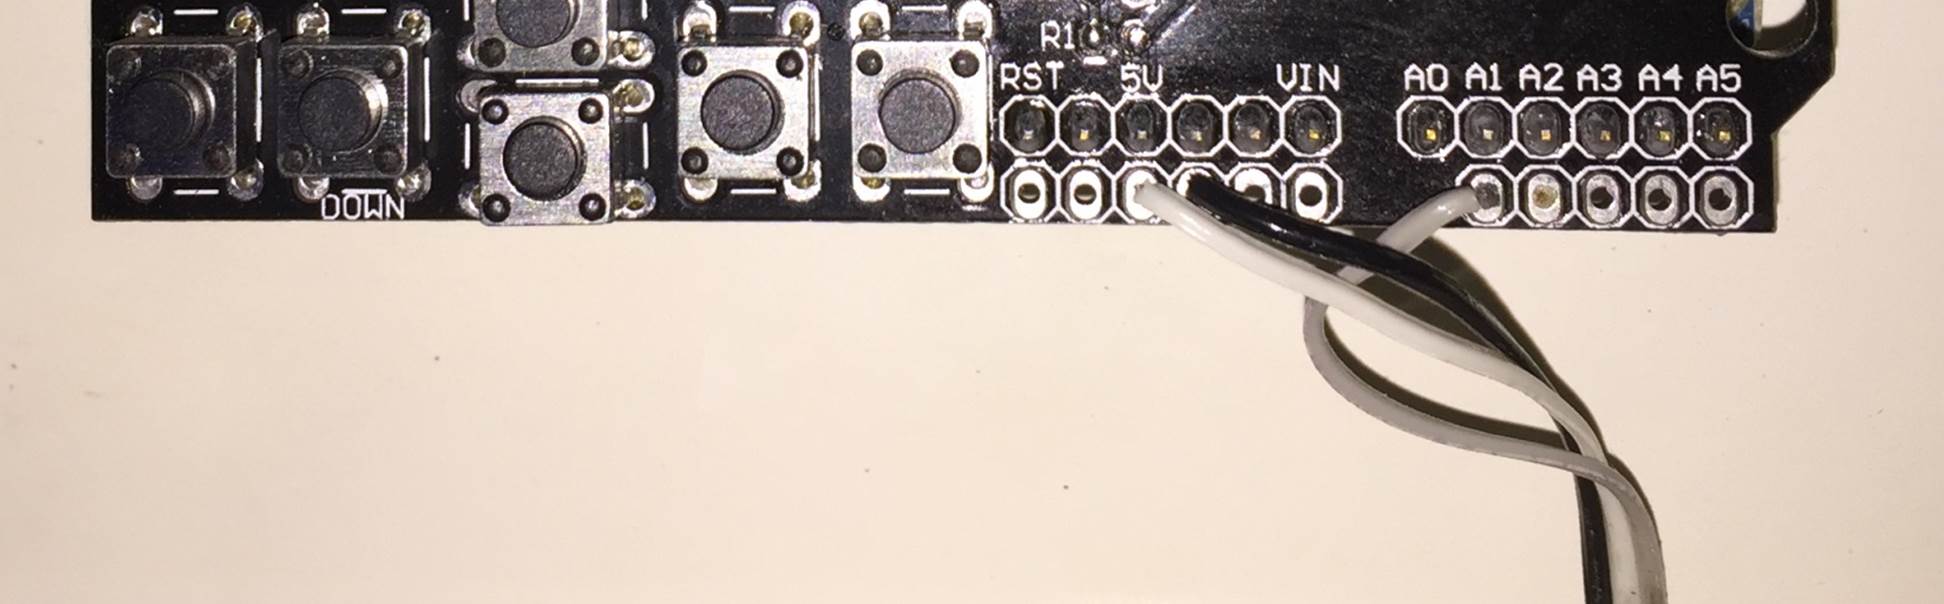
The LCD screen shield already picks up on the analogue inputs but only A0 is used by the shield. Simply solder the three leads from your current sensor onto the pin headers on the shield and use A1 as your sensor input as shown below.
Once you have connected all of your components, you need to connect your sensor onto what you want to monitor. If you are wanting to monitor a couple of appliances then you should connect the CT onto the input lead of a multi-plug, anything you plug into the multi-plug with then be counted.
Alternately, you can connect the CT directly onto your home’s mains supply and monitor the whole houses usage as has been done here. Either way, you need to put the CT around one of the supply cables, preferably the red “live” cable. Be sure to only put it around 1 as it will not work if it is around both and it can’t be connected around the earth wire (yellow, green stripped wire) as energy is not drawn through this wire. If you are connecting it to your mains, connect it to one of the output wires after the main breaker as shown below.
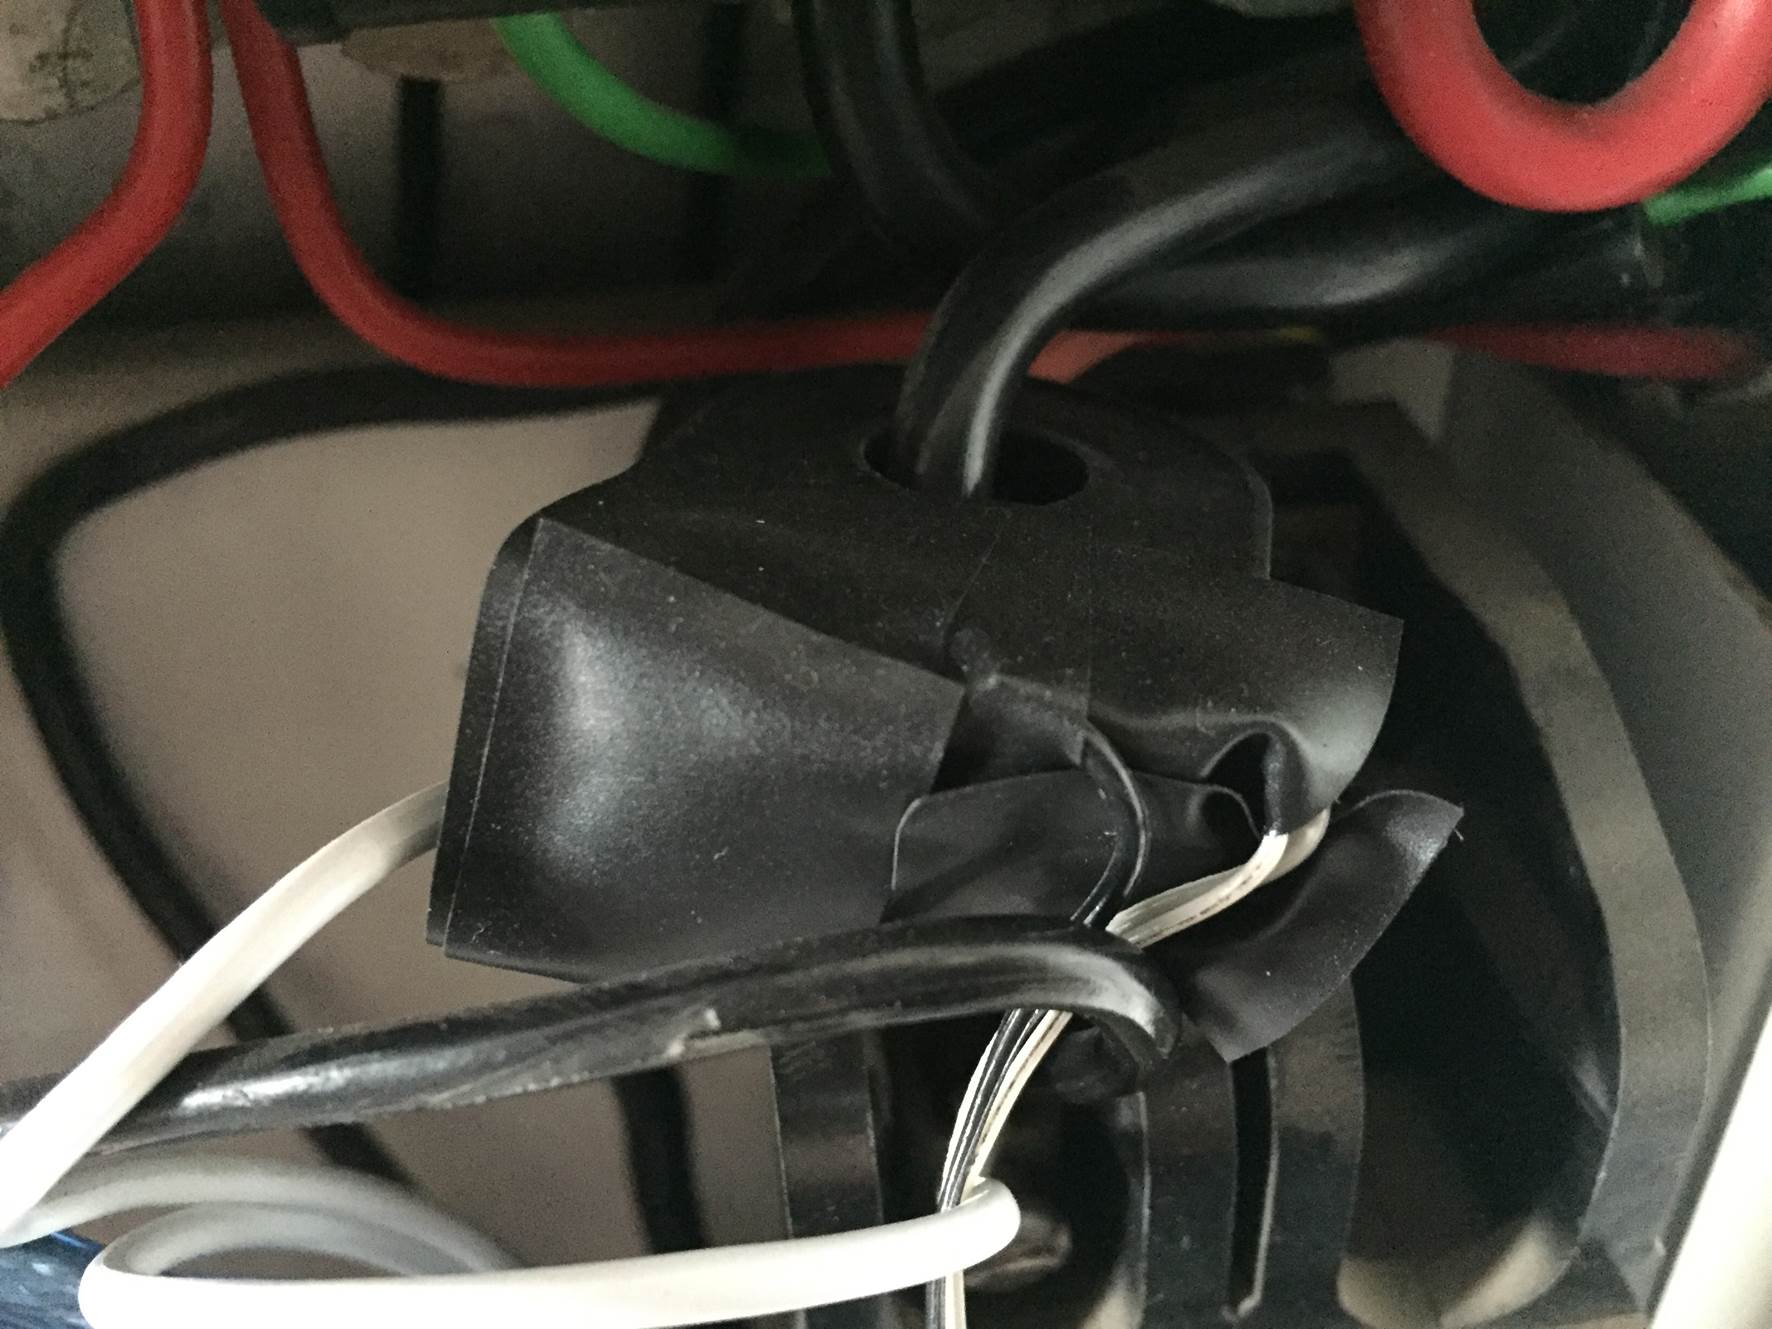
NB – Be careful when connecting the power meter to you homes mains and make sure that the power to your board is switched off before doing anything in the mains box. Do not remove any wires or remove any screws before checking with your local authority, you may require a certified electrician to install the CT for you.
Choosing Different Components
There are essentially four components which need to be chosen or correctly sized for you energy meter.
Choosing A Current Transformer
The first is the CT or current transformer. The one used here is the Talema AC1030 which can sense 30A nominal and 75A maximum current. At 220VAC, it can theoretically sense up to 16.5kW for short periods of time but it is sized to continuously sense 6.6kW which is suitable for a small household. To calculate how many amps yours needs to sense, take the maximum continuous power your are expecting to sense and divide that by your voltage (usually 110V or 220V depending on your country).
Sizing The Burden Resistor
Next you need to size your burden resistor R3, this converts your CT current into a voltage reference. Start by dividing your primary current (the maximum as used above) by your CT’s turns ratio (available on the data sheet). This should be around 500-5000 to 1. This article worked on 42A with a turns ratio 0f 1000:1 giving a secondary current of 0.042A or 42mA. Your analogue reference voltage to the Arduino is 2.5V so to determine the resistance you use R=V/I – R=2.5/0.042=59.5Ω. The closest standard resistor value is 56Ω, so this was used.
Here are some options on different CTs and their ideal burden resistors (in standard sizes):
- Murata 56050C – 10A – 50:1 – 13Ω
- Talema AS-103 – 15A – 300:1 – 51Ω
- Talema AC-1020 – 20A – 1000:1 – 130Ω
- Alttec L01-6215 – 30A – 1000:1 – 82Ω
- Alttec L01-6216 – 40A – 1000:1 – 62Ω
- Talema ACX-1050 – 50A – 2500:1 – 130Ω
- Alttec L01-6218 – 60A – 1000:1 – 43Ω
- Talema AC-1060 – 60A – 1000:1 – 43Ω
- Alttec L01-6219 – 75A – 1000:1 – 33Ω
- Alttec L01-6221 – 150A – 1000:1 – 18Ω
- CTYRZCH SCT-013-000 – 100A – Built In Burden Resistor – Buy Here
- TOOGOO SCT-013-000 – 100A – Buy Here
The capacitor used is 10µF which should be sufficient for most CT ranges for household applications.
Finally you need two dividing resistors to get the 2.5V reference voltage from the Arduino. They must be the same value, so R1=R2 and we don’t need much current so this articles uses two 100K resistors.
Upload the Sketch
Now you can upload your sketch onto your Arduino, if you haven’t uploaded a sketch before then follow this guide on getting started.
Update – The code has since been modified to make use of the millis() function, see end of section for updated code.
//Michael Klements
//The DIY Life
//27 October 2014

#include <LiquidCrystal.h>

int currentPin = 1;              //Assign CT input to pin 1
double kilos = 0;
int peakPower = 0;
LiquidCrystal lcd(8, 9, 4, 5, 6, 7);  //Assign LCD screen pins, as per LCD shield requirements

void setup()
{
  lcd.begin(16,2);              // columns, rows.  use 16,2 for a 16x2 LCD, etc.
  lcd.clear();
  lcd.setCursor(0,0);           // set cursor to column 0, row 0 (the first row)
  lcd.print("Running");
}

void loop()
{
  int current = 0;
  int maxCurrent = 0;
  int minCurrent = 1000;
  for (int i=0 ; i<=200 ; i++)  //Monitors and logs the current input for 200 cycles to determine max and min current
  {
    current = analogRead(currentPin);    //Reads current input and records maximum and minimum current
    if(current >= maxCurrent)
      maxCurrent = current;
    else if(current <= minCurrent)
      minCurrent = current;
  }
  if (maxCurrent <= 517)
  {
    maxCurrent = 516;
  }
  double RMSCurrent = ((maxCurrent - 516)*0.707)/11.8337;    //Calculates RMS current based on maximum value
  int RMSPower = 220*RMSCurrent;    //Calculates RMS Power Assuming Voltage 220VAC, change to 110VAC accordingly
  if (RMSPower > peakPower)
  {
    peakPower = RMSPower;
  }
  kilos = kilos + (RMSPower * (2.05/60/60/1000));    //Calculate kilowatt hours used
  delay (2000);
  lcd.clear();
  lcd.setCursor(0,0);           // Displays all current data
  lcd.print(RMSCurrent);
  lcd.print("A");
  lcd.setCursor(10,0);
  lcd.print(RMSPower);
  lcd.print("W");
  lcd.setCursor(0,1);
  lcd.print(kilos);
  lcd.print("kWh");
  lcd.setCursor(10,1);
  lcd.print(peakPower);
  lcd.print("W");
}
Here is the link to download the Meter code.
Because your setup, CT , resistors and input voltage may be different, there is a scaling factor in the sketch which you will need to change before you will get accurate results, see below for calibration. If your LCD is connected to the same pins as used here and your CT is connected to the same input pin, you should at least get the screen populated with some figures although these will most likely be incorrect and some may be negative.
If you don’t want to use or don’t have an LCD screen, you can also modify the sketch to output to the Arduino IDE’s serial window as shown below.
//Michael Klements
//The DIY Life
//27 October 2014

int currentPin = 1;              //Assign CT input to pin 1
double kilos = 0;
int peakPower = 0;

void setup()
{
  Serial.begin(9600);            //Start serial communication
  Serial.println("Running");
}

void loop()
{
  int current = 0;
  int maxCurrent = 0;
  int minCurrent = 1000;
  for (int i=0 ; i<=200 ; i++)  //Monitors and logs the current input for 200 cycles to determine max and min current
  {
    current = analogRead(currentPin);    //Reads current input and records maximum and minimum current
    if(current >= maxCurrent)
      maxCurrent = current;
    else if(current <= minCurrent)
      minCurrent = current;
  }
  if (maxCurrent <= 517)
  {
    maxCurrent = 516;
  }
  double RMSCurrent = ((maxCurrent - 516)*0.707)/11.8337;    //Calculates RMS current based on maximum value
  int RMSPower = 220*RMSCurrent;    //Calculates RMS Power Assuming Voltage 220VAC, change to 110VAC accordingly
  if (RMSPower > peakPower)
  {
    peakPower = RMSPower;
  }
  kilos = kilos + (RMSPower * (2.05/60/60/1000));    //Calculate kilowatt hours used
  delay (2000);
  Serial.print(RMSCurrent);
  Serial.println("A");
  Serial.print(RMSPower);
  Serial.println("W");
  Serial.print(kilos);
  Serial.println("kWh");
  Serial.print(peakPower);
  Serial.println("W");
}
Here is the link to download the Meter Serial Output code.
Code Update
The original Energy Meter code made use of a fixed time period for calculating the kilowatt hours consumed, this was based on a 2050ms cycle time and was fairly accurate.
The code has since been modified to make use of the built in millis() function which calculates the exact cycle time for each cycle in order to improve the accuracy. It only makes around a half a percent improvement in the accuracy of the calculation but its the better way to do it.
Here is the improved code:
//Michael Klements
//The DIY Life
//26 February 2017

#include <LiquidCrystal.h>

int currentPin = 1;              //Assign CT input to pin 1
double kilos = 0;
int peakPower = 0;
unsigned long startMillis;
unsigned long endMillis;
LiquidCrystal lcd(8, 9, 4, 5, 6, 7);  //Assign LCD screen pins, as per LCD shield requirements

void setup()
{
  lcd.begin(16,2);              // columns, rows.  use 16,2 for a 16x2 LCD, etc.
  lcd.clear();
  lcd.setCursor(0,0);           // set cursor to column 0, row 0 (the first row)
  lcd.print("Arduino");
  lcd.setCursor(0,1);           // set cursor to column 0, row 1 (the second row)
  lcd.print("Energy Meter");
  startMillis = millis();
}

void loop()
{
  int current = 0;
  int maxCurrent = 0;
  int minCurrent = 1000;
  for (int i=0 ; i<=200 ; i++)  //Monitors and logs the current input for 200 cycles to determine max and min current
  {
    current = analogRead(currentPin);    //Reads current input and records maximum and minimum current
    if(current >= maxCurrent)
      maxCurrent = current;
    else if(current <= minCurrent)
      minCurrent = current;
  }
  if (maxCurrent <= 517)
  {
    maxCurrent = 516;
  }
  double RMSCurrent = ((maxCurrent - 516)*0.707)/11.8337;    //Calculates RMS current based on maximum value
  int RMSPower = 220*RMSCurrent;    //Calculates RMS Power Assuming Voltage 220VAC, change to 110VAC accordingly
  if (RMSPower > peakPower)
  {
    peakPower = RMSPower;
  }
  endMillis = millis();
  unsigned long time = endMillis - startMillis;
  kilos = kilos + ((double)RMSPower * ((double)time/60/60/1000000));    //Calculate kilowatt hours used
  startMillis = millis();
  delay (2000);
  lcd.clear();
  lcd.setCursor(0,0);           // Displays all current data
  lcd.print(RMSCurrent);
  lcd.print("A");
  lcd.setCursor(10,0);
  lcd.print(RMSPower);
  lcd.print("W");
  lcd.setCursor(0,1);
  lcd.print(kilos);
  lcd.print("kWh");
  lcd.setCursor(10,1);
  lcd.print(peakPower);
  lcd.print("W");
}
Here is the link to download the updated Millis Meter code.
For those of you who have read that the millis() function goes into overflow after about 49 days, the code deals with the rollover automatically by making use of the unsigned long variable. For example, if the overflow happens at 10000, the start millis was 9987 and the end millis was 2031, the difference would be 2031-9987=-7956 but the value can’t be negative as it is unsigned so it becomes -7956+10000=2044 which is the correct duration.
Calibrate the Current Reading
As mentioned above, because your setup, CT , resistors and input voltage may be different, there is a scaling factor in the sketch which you will need to change before you will get accurate results.
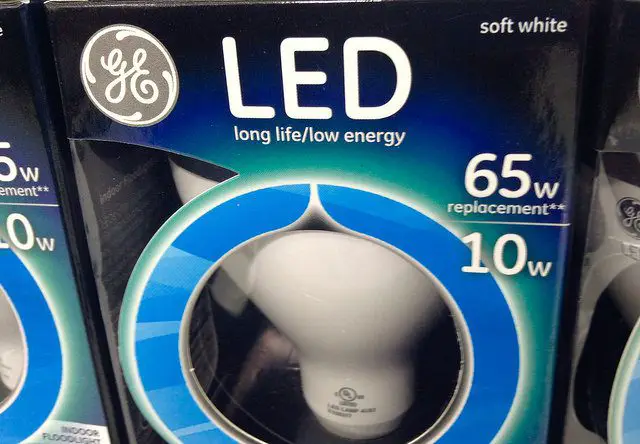
To calibrate your energy meter, your need to be sure that the current that your meter says is being drawn is what you expect is actually being drawn. In order to do this accurately, you need to find a calibrated load. These are not easy to come by in a normal household so you will need to find something which uses an established and consistent amount of power. I used a couple of incandescent light bulbs and spot lights, these come in a range of sizes and their consumption is fairly close to what is stated on the label, ie a 100W light bulb uses very close to 100W of real power as it is almost entirely a purely resistive load.
Plug in a small light bulb (100W or so) and see what load is displayed. You will now need to adjust the scaling factor uses in the calculation line:
double RMSCurrent = ((maxCurrent – 516)*0.707)/11.8337
In this case it was 11.8337, it may be higher or lower depending on your application. Either use linear scaling to calculate this figure or, if you’re not good with math, play around with different values until the load you have plugged in is shown on the energy meter’s screen.
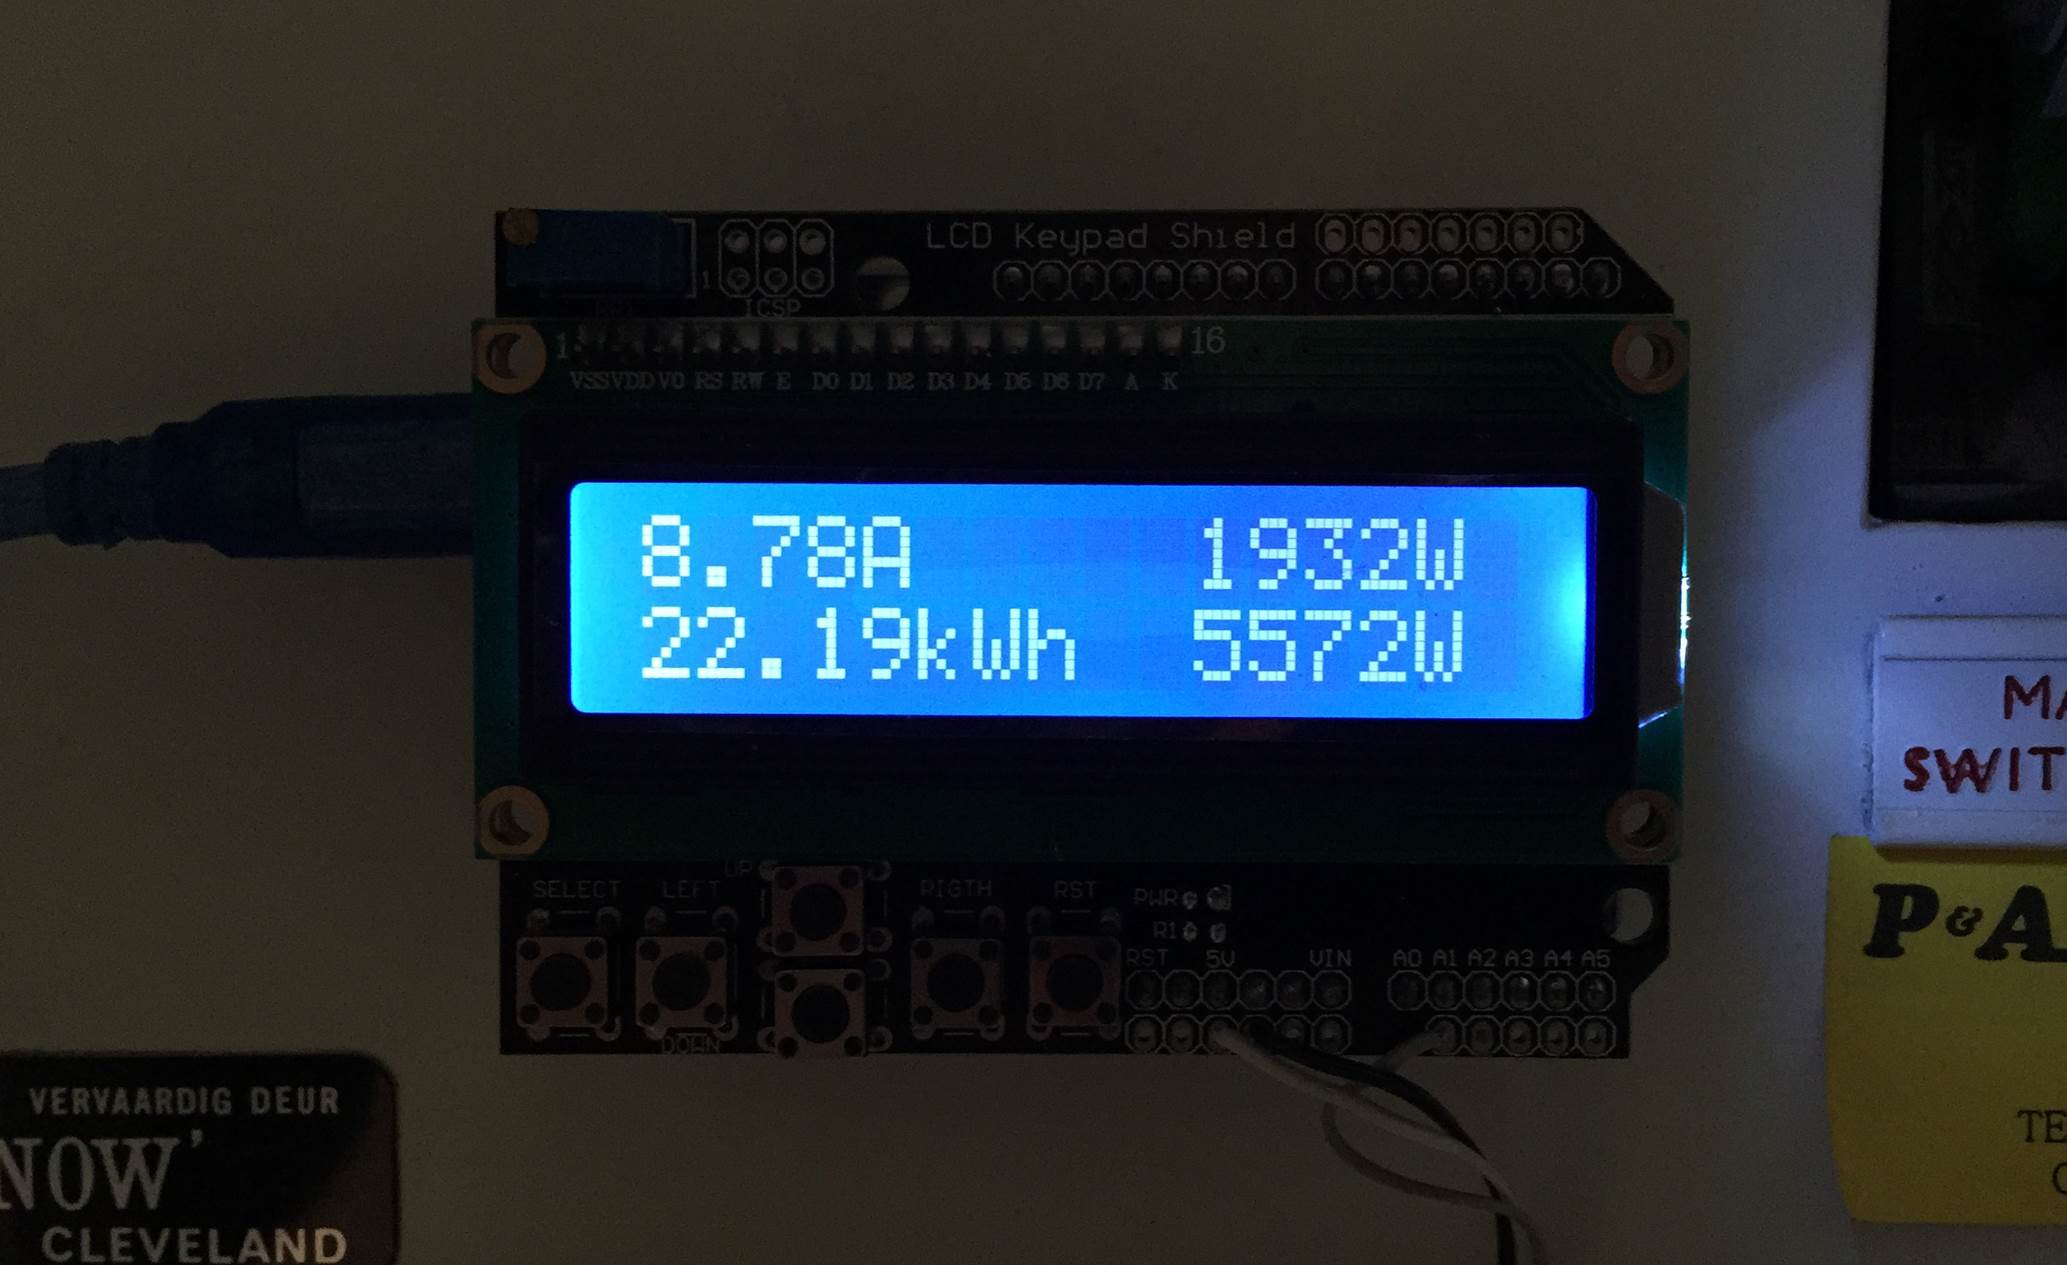
Once you have your energy meter calibrated, you reset it and leave it to do its job. Below are two images of it in use, both with a low power input and a high power input.
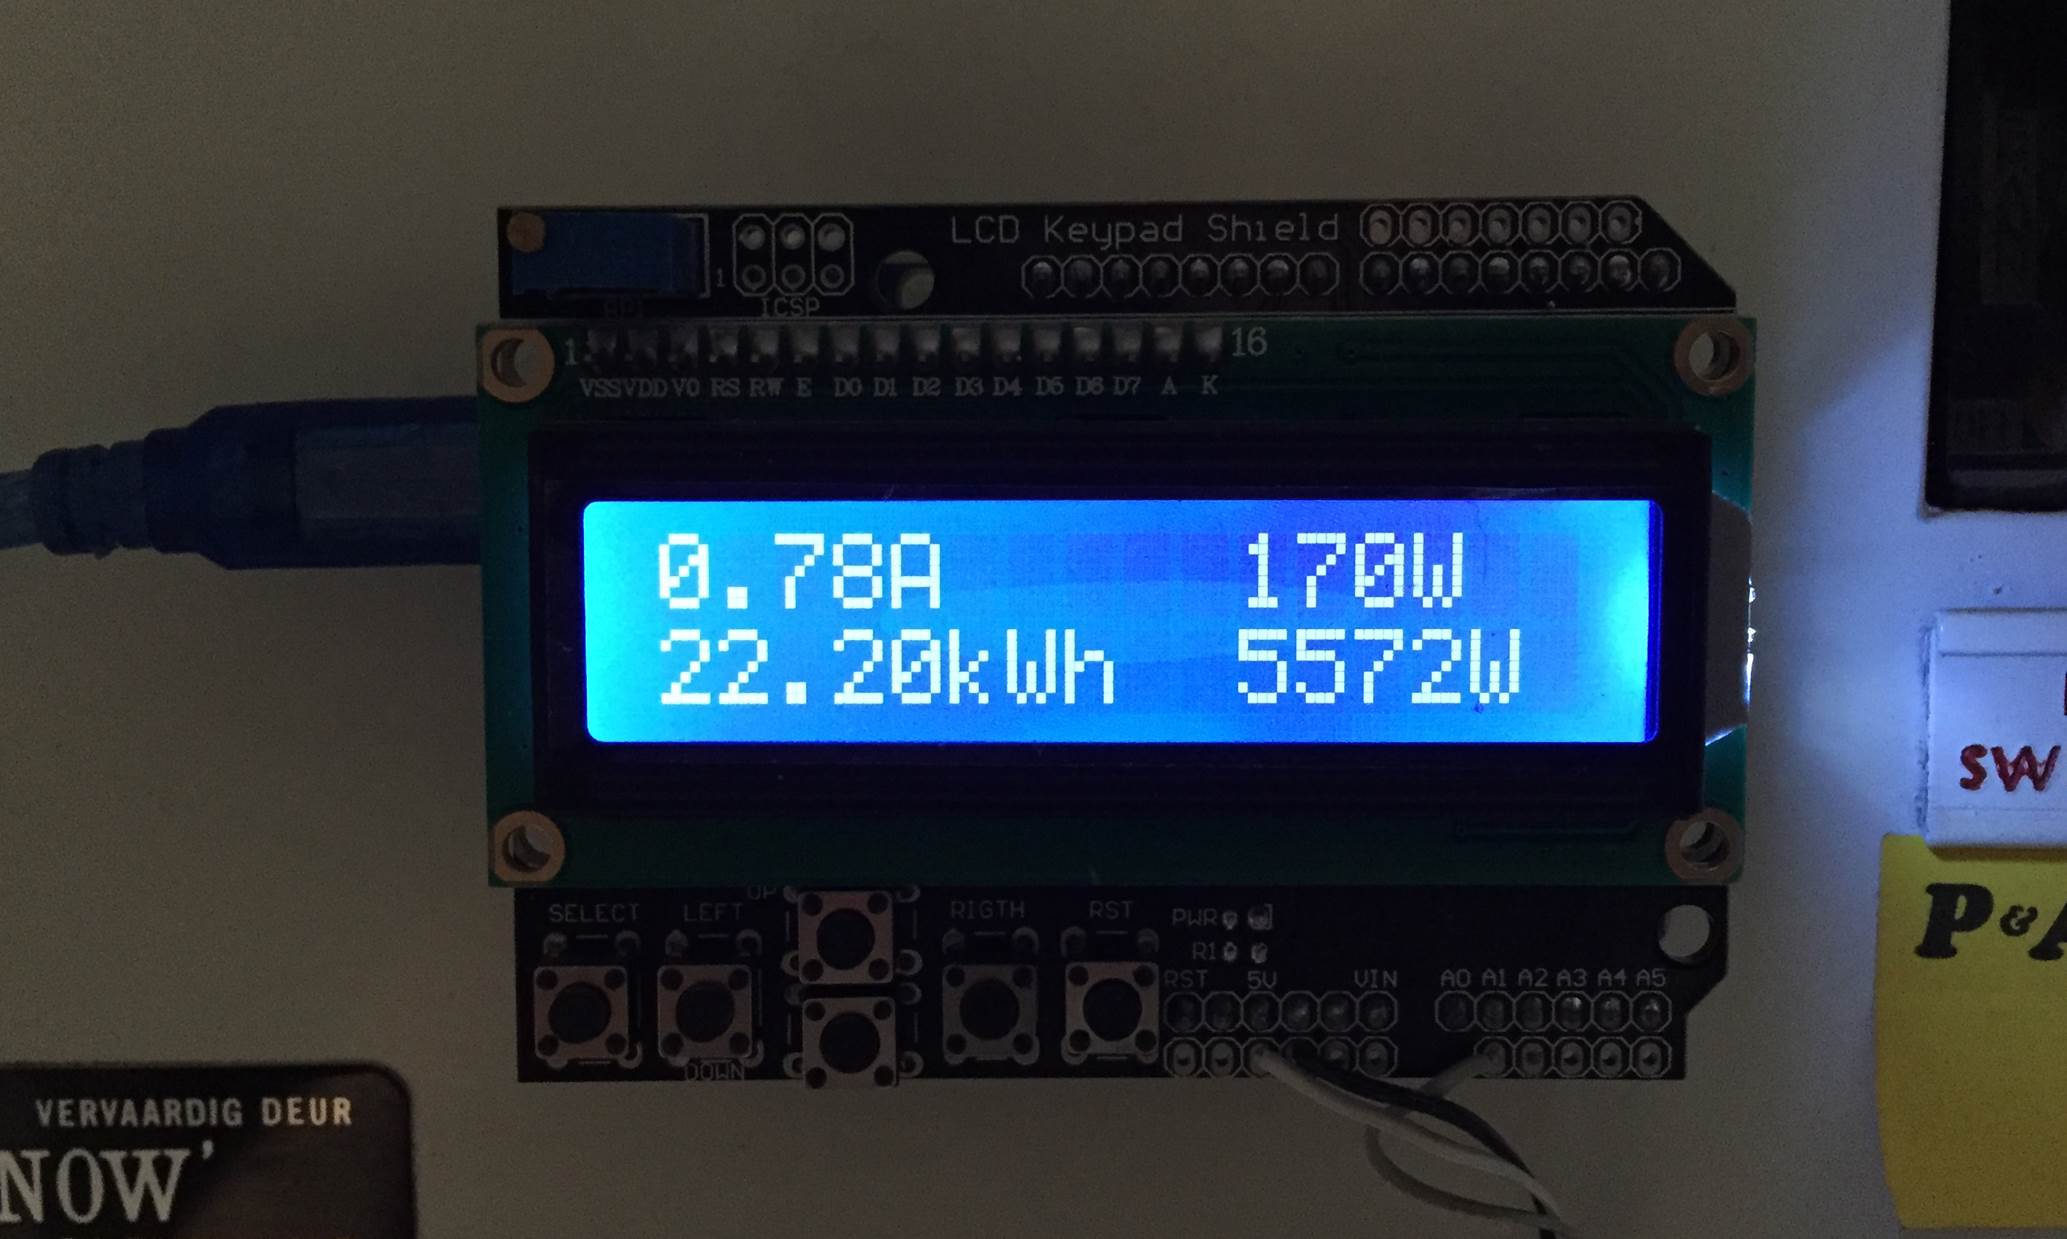
The first number displayed is the instantaneous current followed by the instantaneous power. On the bottom line, the kilowatt hours used since reset and then the maximum recorded power since reset.
And a video of startup:
Video Guide
How did this project go for you? What have you used it to monitor? Let us know in the comments section below, we may even put some of your work into our article to help others. Also feel free to post any questions or queries you may have, if you are asking, chances are someone else is wondering as well.