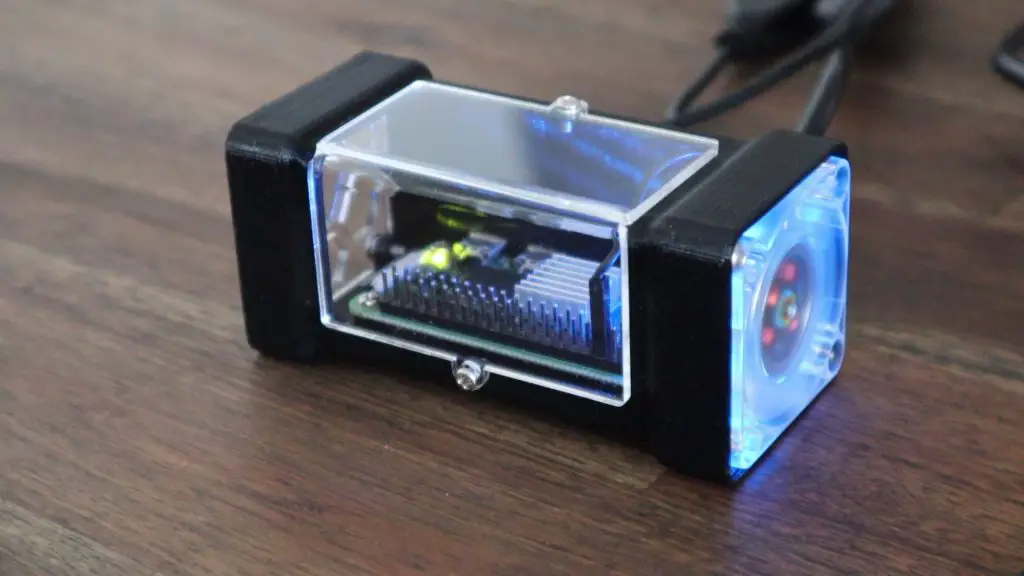
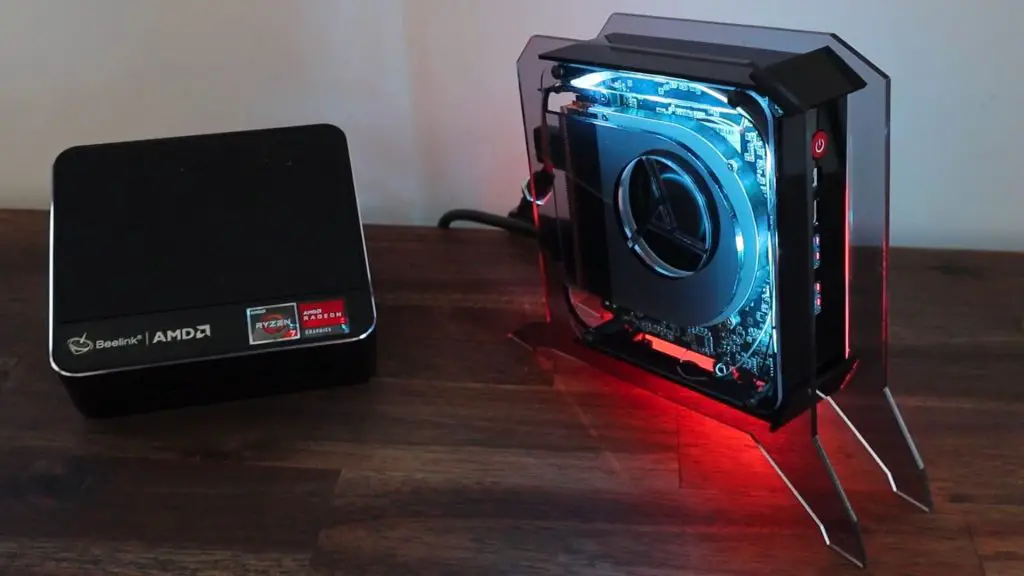
If you’ve been following my projects for a while then you’re probably aware that I like to do unnecessary things, like building a water-cooled Raspberry Pi cluster, or this desktop version of a water-cooled Pi. As cool as these may look, they’re not all that practical, so today we’re going to build something that is a little more practical, although is still a bit unnecessary.
We’re going to build the ultimate water-cooled Raspberry Pi desktop computer and try to give it all of the bells and whistles, including front-facing USB ports, a power button, an OLED stats display and an NVME SSD.
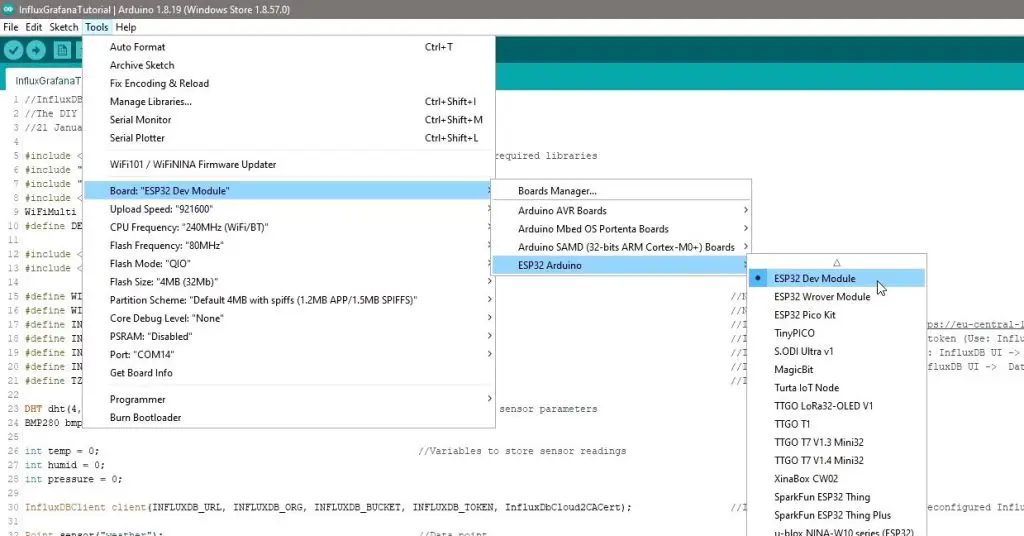
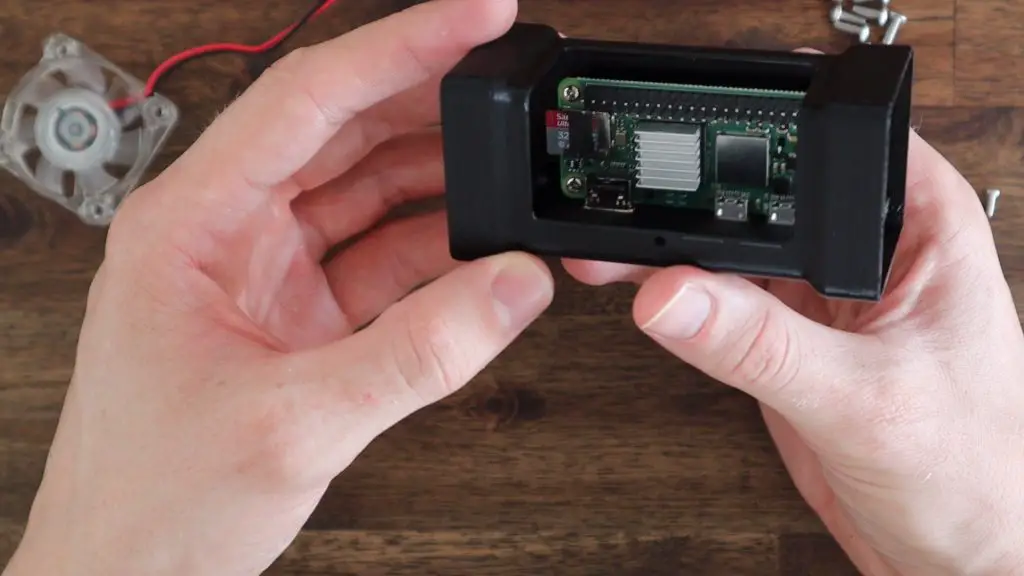
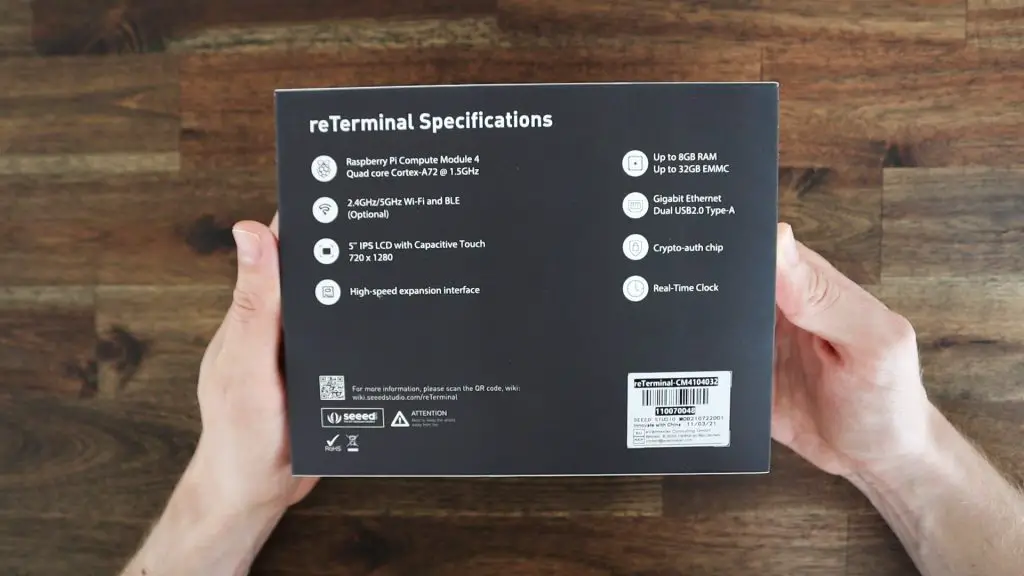
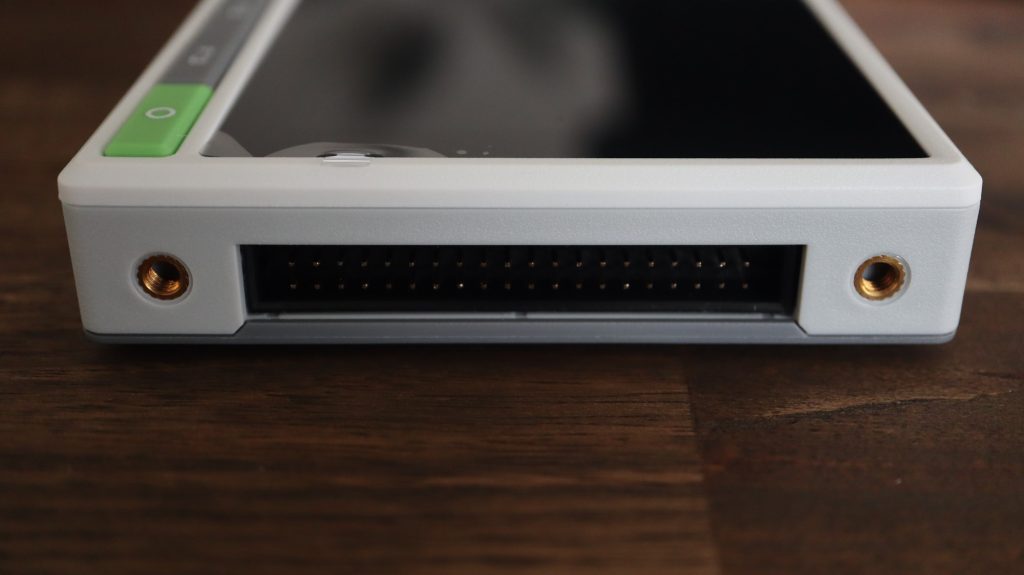
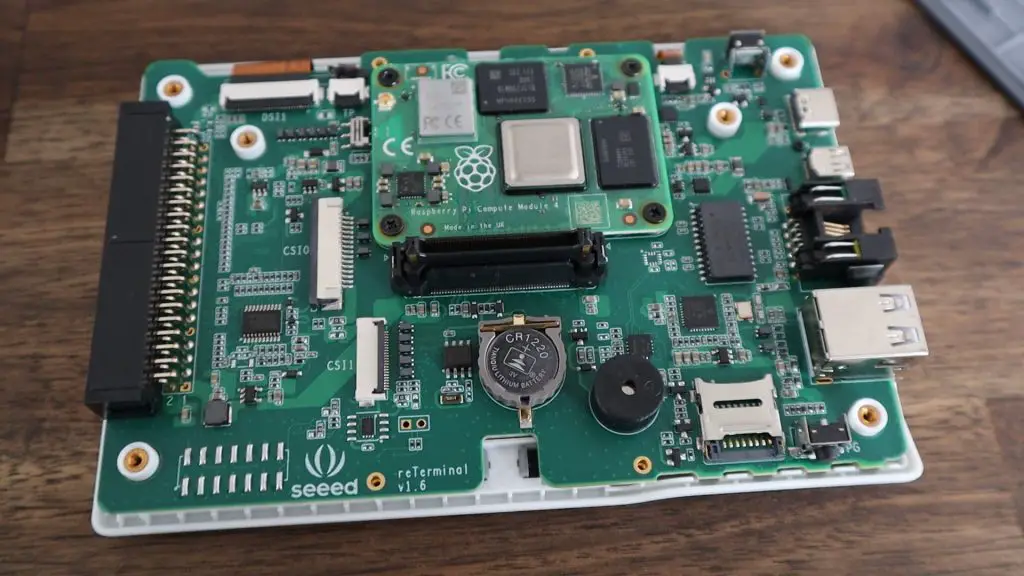
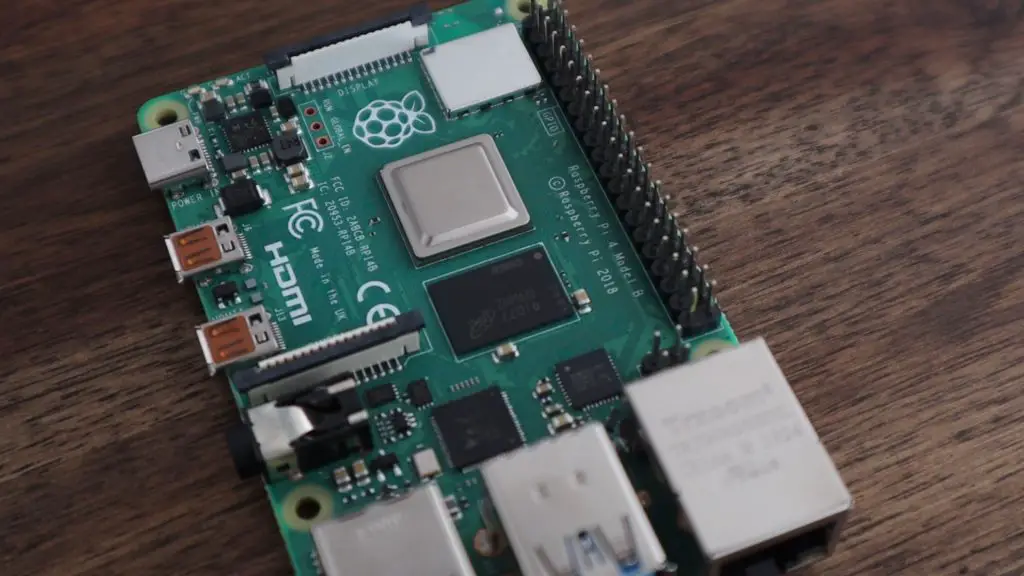
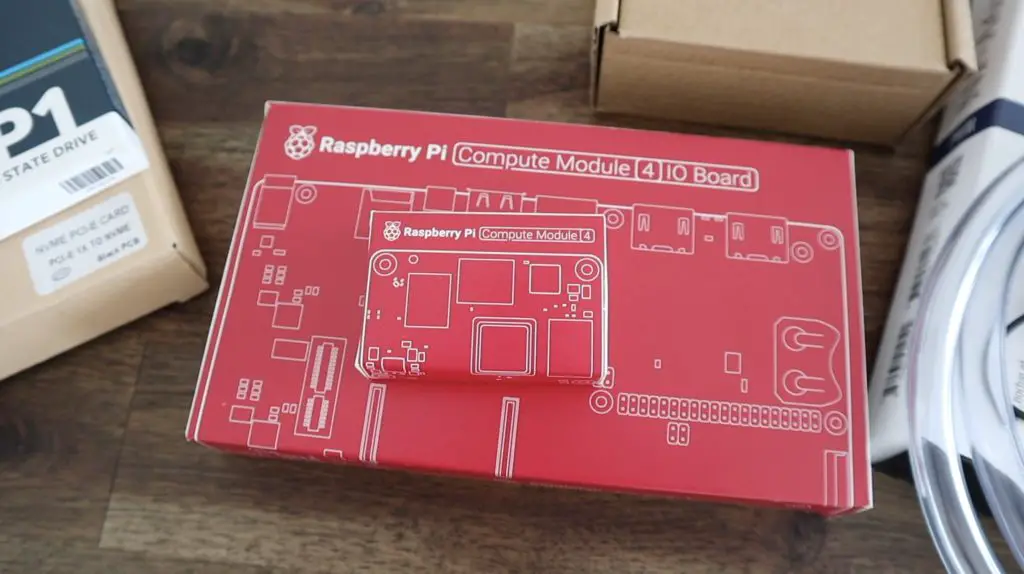
I’m going to be using a Raspberry Pi Compute Module 4, or CM4 for short, for this build so that I can use the CM4 IO Board for a number of features which we’ll get into in a bit.
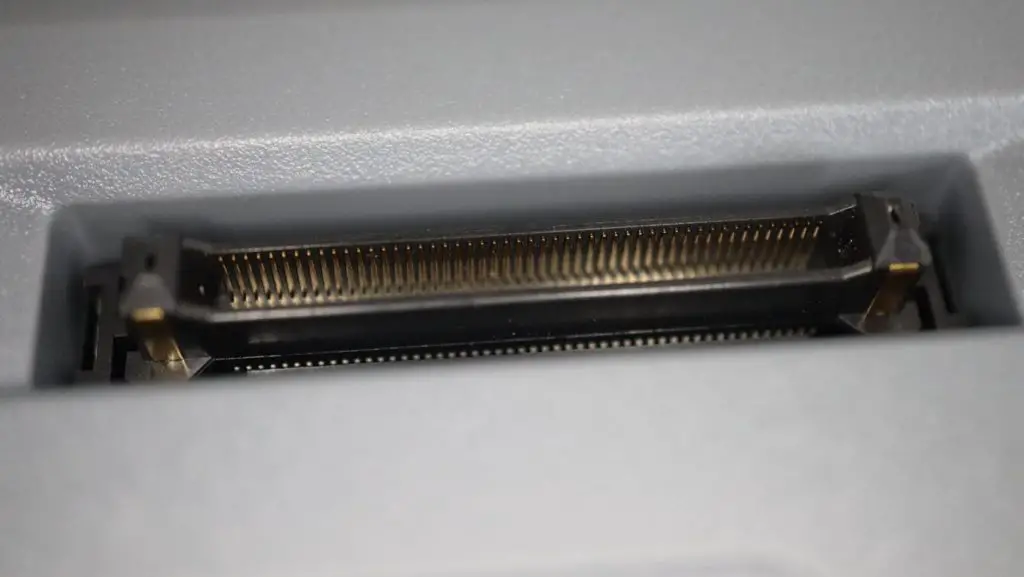
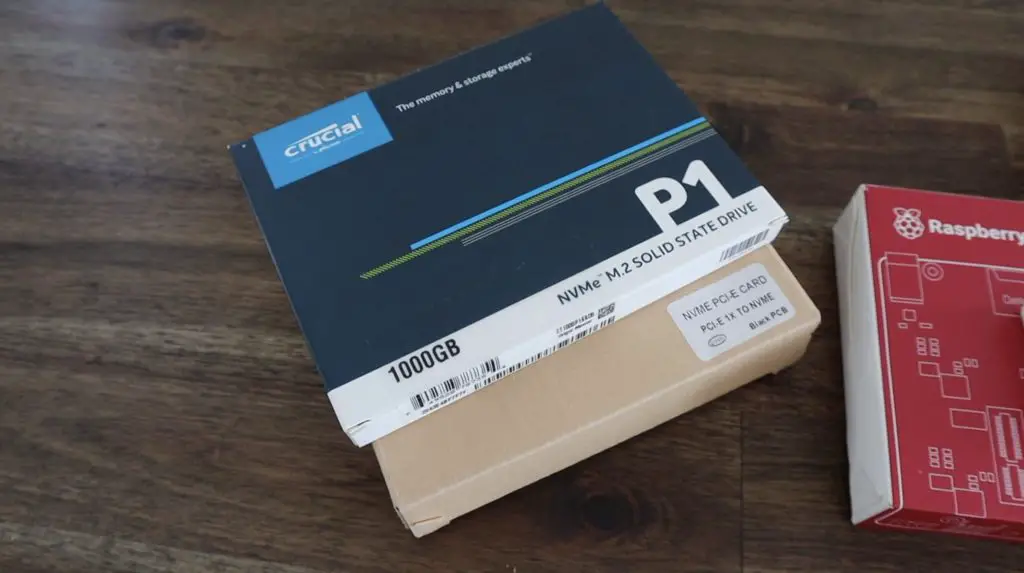
I’m going to be adding a 1TB NVME drive which will be attached to the Pi using the PCIe Gen 2 socket on the IO Board and a PCI express adaptor.
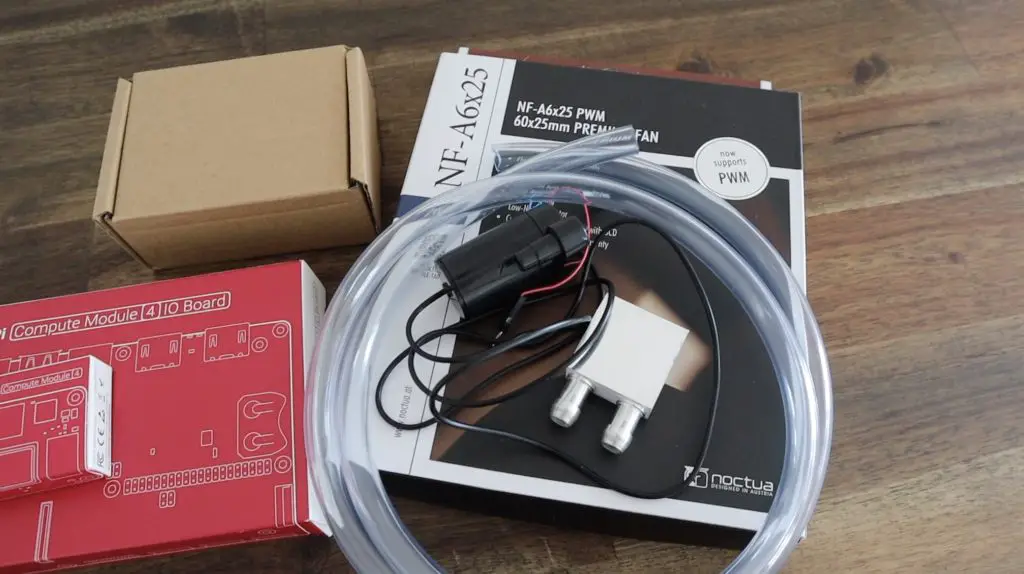
Lastly, for the unnecessary part, I’m going to water cool the CM4 module using 60mm radiator and Noctua fan as well as a small cooling block and pump.
On the front of the case, I’m going to add two USB ports, a power button and an OLED display.
Here’s my video of the build, read on for the full write-up:
What You Need For This Project
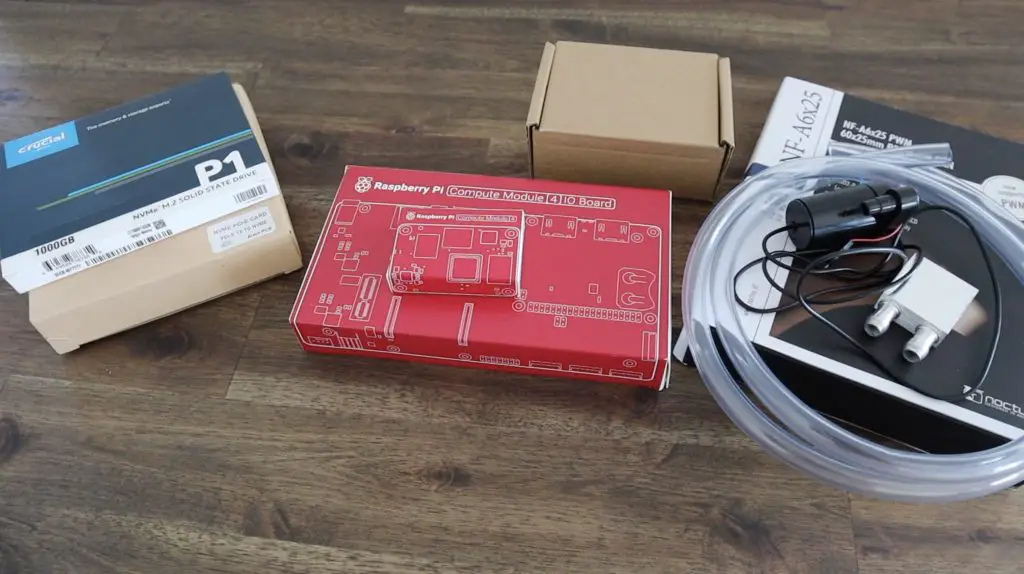
There are a number of smaller parts used in this build that I just had lying around or repurposed, but these are the main components you’ll need if you’d like to try to tackle building your own ultimate Raspberry Pi desktop computer.
- Raspberry Pi CM4 Lite 8GB WiFi (Out of Stock on Most Online Stores) – Buy Here
- Raspberry Pi CM4 IO Board – Buy Here
- 1TB Crucial M.2 NVME Drive – Buy Here
- M.2 to PCIe Adaptor – Buy Here
- Noctua NF-A6x25 FLX Fan – Buy Here
- 60mm Radiator – Buy Here
- 30mm Water Cooling Block – Buy Here
- 5V DC Pump – Buy Here
- 10mm Flexible Tubing – Buy Here
- Opaque White Coolant – Buy Here
- USB Splitter Cable – Buy Here
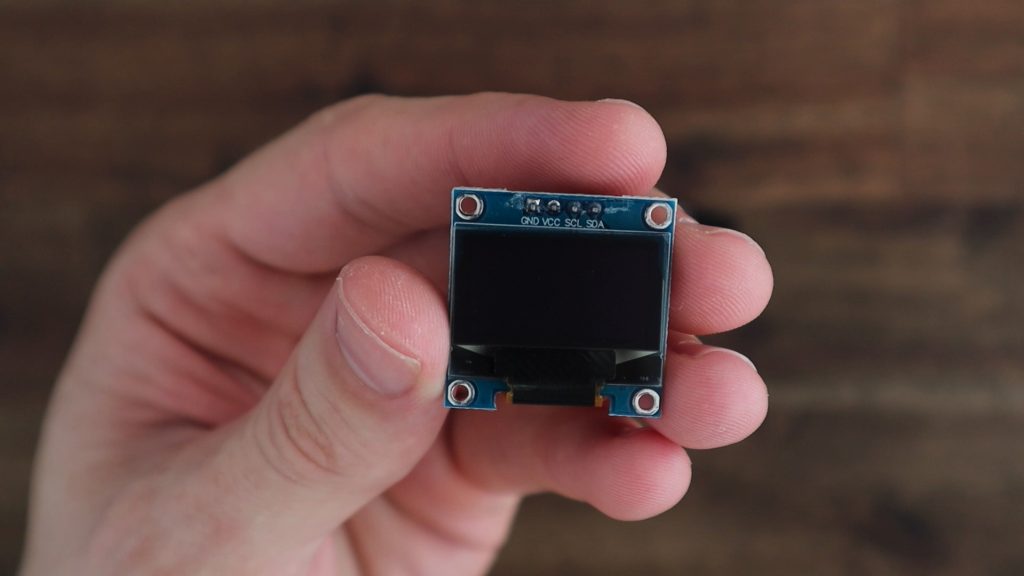
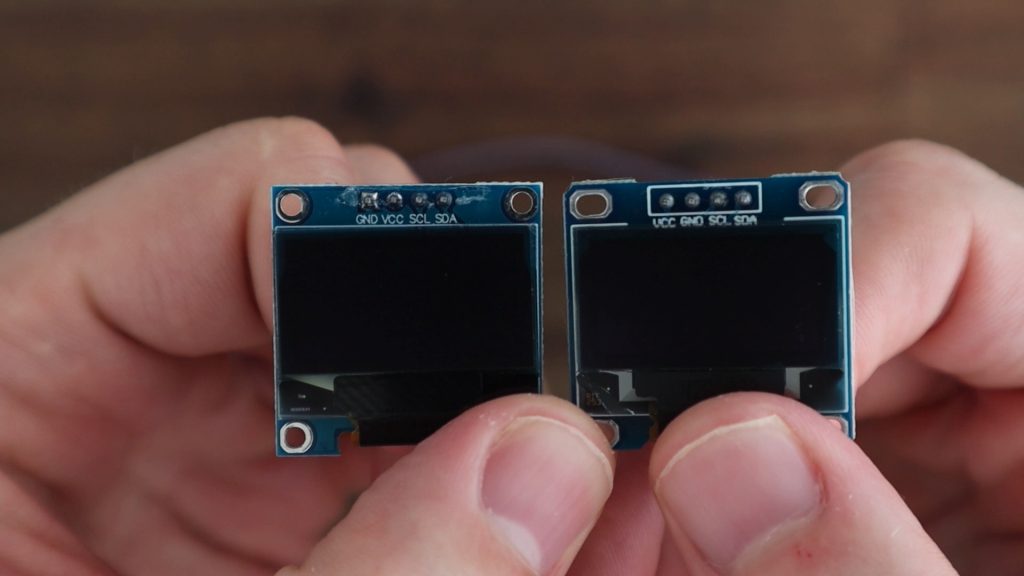
- I2C OLED Display – Buy Here
- Ring Light Power Button – Buy Here
- Breadboard Jumpers – Buy Here
- M2.5 Brass Standoff Set – Buy Here
- M2.5 x 12mm Button Head Screws – Buy Here
- M3 x 8mm Button Head Screws – Buy Here
- Matt White, Clear and Black 3mm Acrylic Sheets (Best Sourced Locally) – Buy Here
- Dupont Connector Set – Buy Here
- Black PLA Filament – Buy Here
- White PLA Filament – Buy Here
Equipment Used
In addition to the parts used above, I’ve used the below equipment and tools to complete the project.
- K40 Laser Cutter/Engraver – Buy Here
- Creality Ender 3 V2 3D Printer – Buy Here
- Xiaomi Pencil Electric Screwdriver Set – Buy Here
- Dremel Versatip Soldering Iron – Buy Here
- Dupont Connector Crimpers – Buy Here
Some of the above parts are affiliate links. By purchasing products through the above links, you’ll be supporting my projects, with no additional cost to you.
Let’s Take A Closer Look At The Hardware We’re Going To Use For Our Raspberry Pi Computer
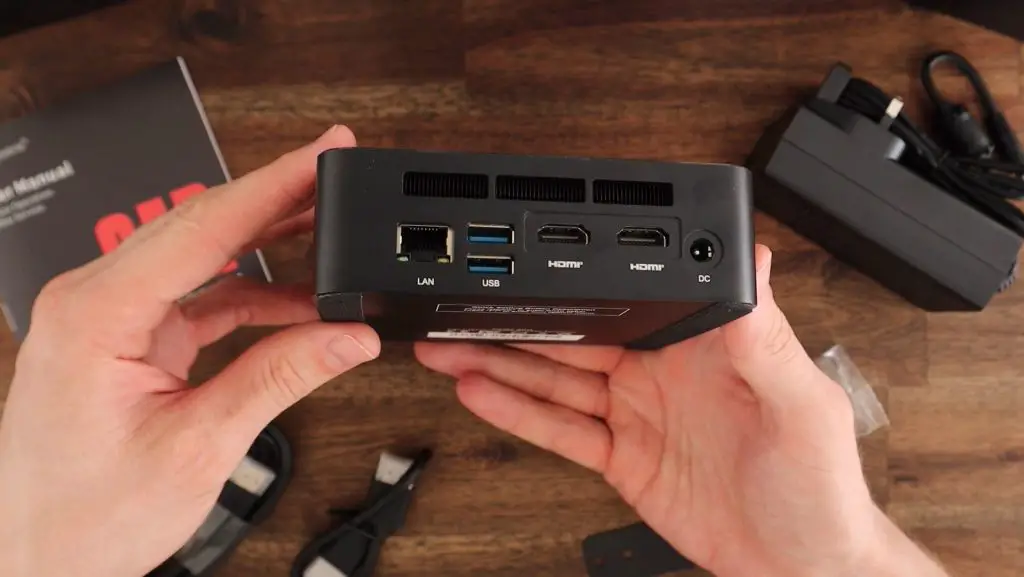
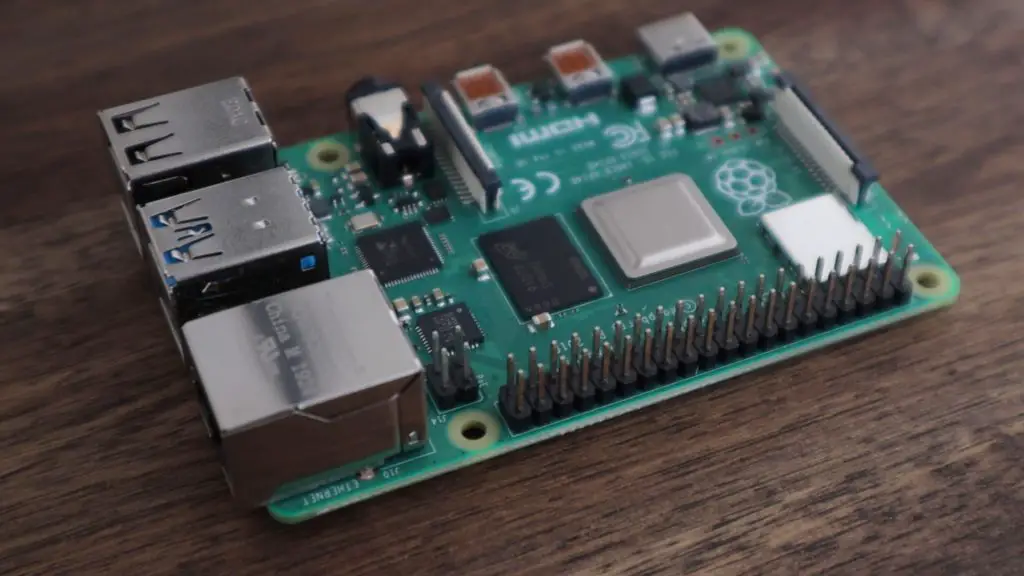
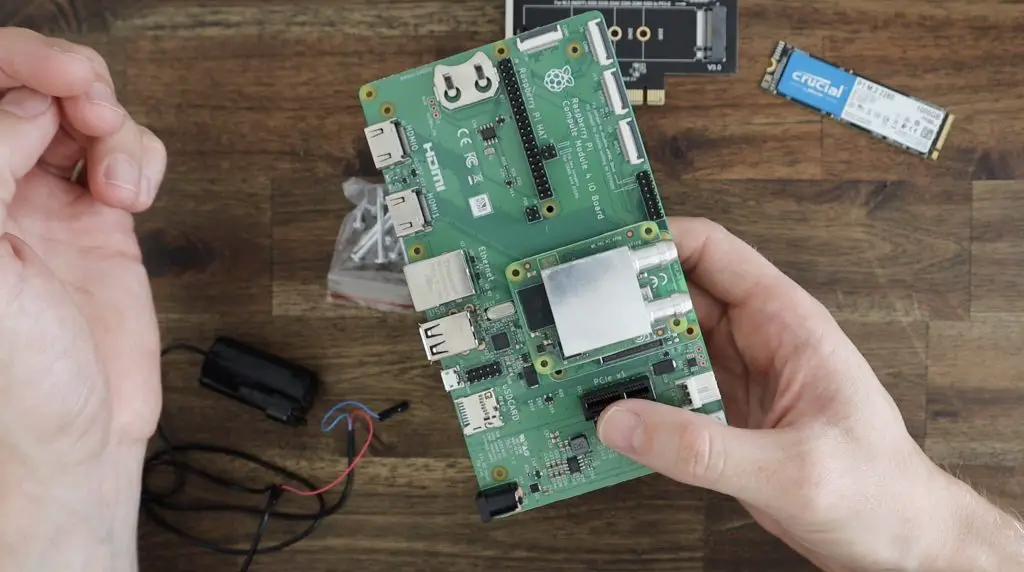
Let’s start out by taking a look at the IO board and some of the reasons why I decided to use it over a regular Pi 4.
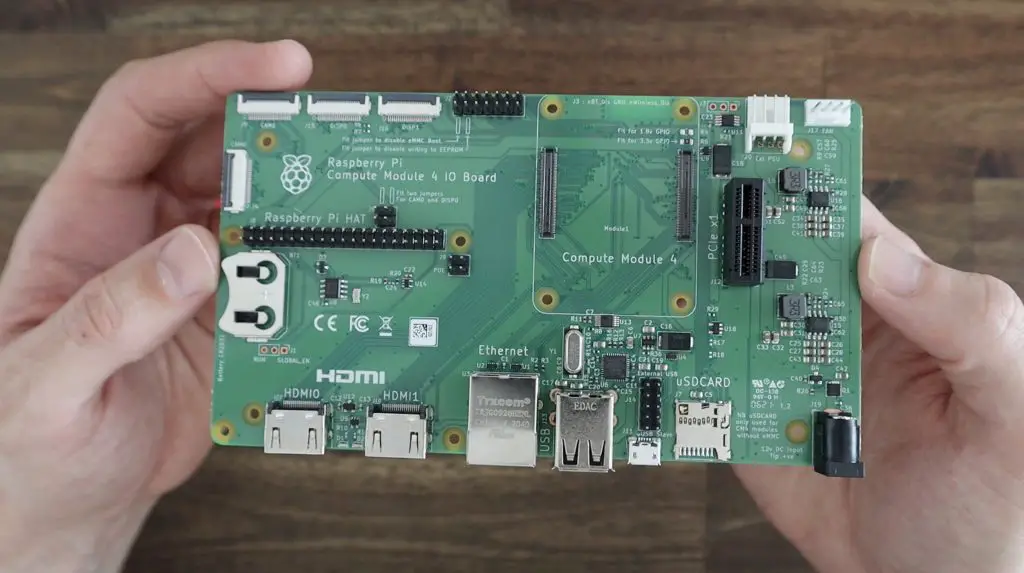
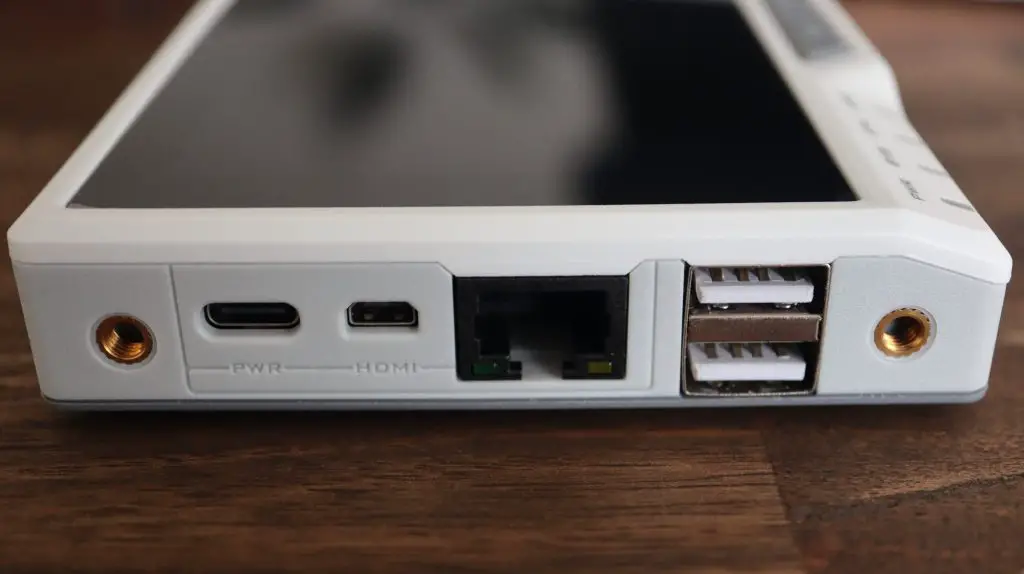
For a start, all of the ports are on one side and we have access to two full-size HDMI ports. We also have a J17 barrel jack for a 12V power supply, so we can drive 12V components like devices connected to the PCIe slot and the Noctua fan. This also ensures that we have enough current to power the Pi and an attached SSD, which can be a problem with the Pi 4.
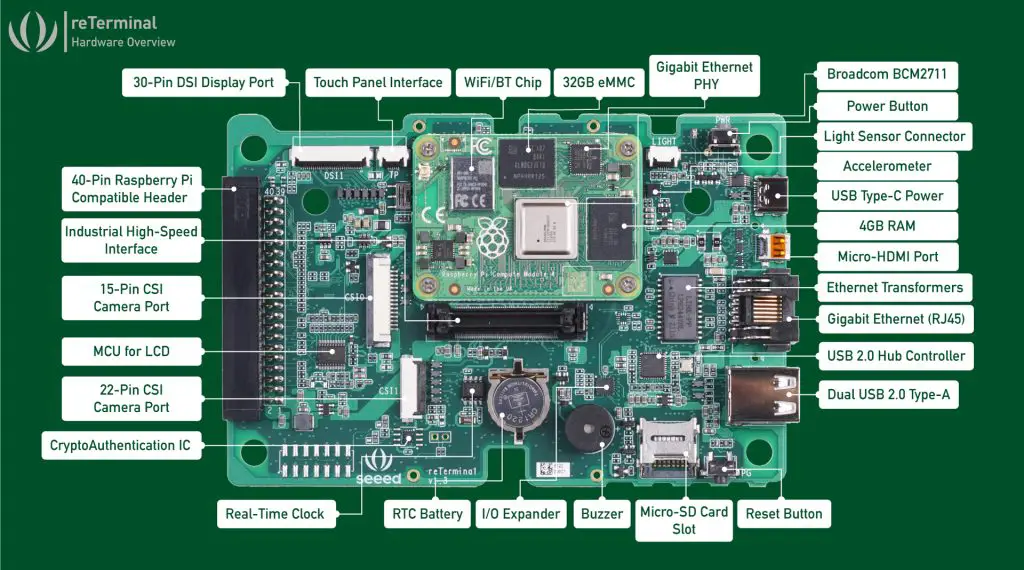
The IO board also has header pins available for external USB ports, a 12V Molex fan connector with I2C PWM drive and tacho feedback, a full set of GPIO pins and a number of additional IO connectors.
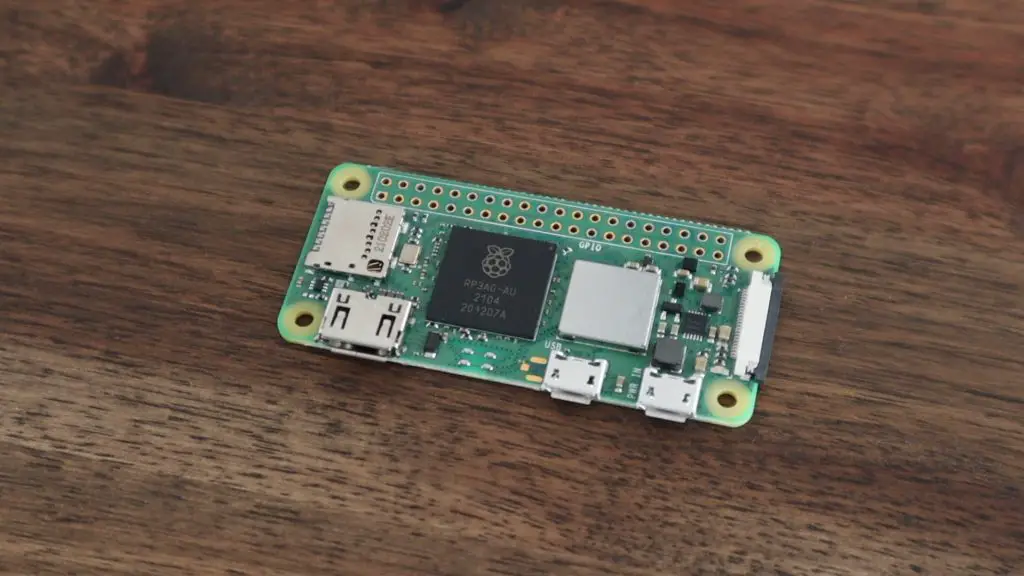
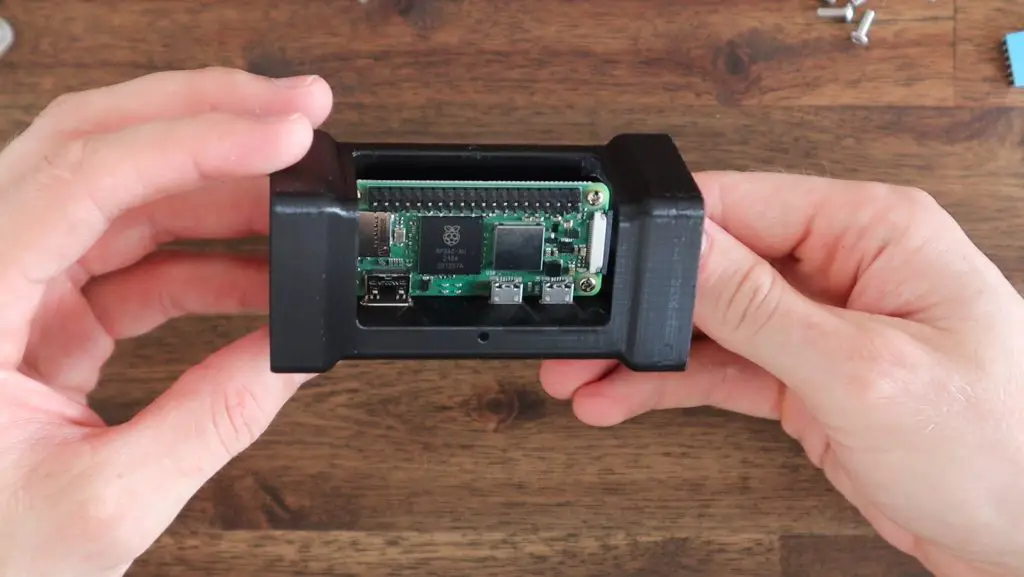
I’m going to be using a CM4 Lite module. This means that it doesn’t have onboard eMMC storage, but we’re not going to use this anyway because we’re using an NVME SSD drive.
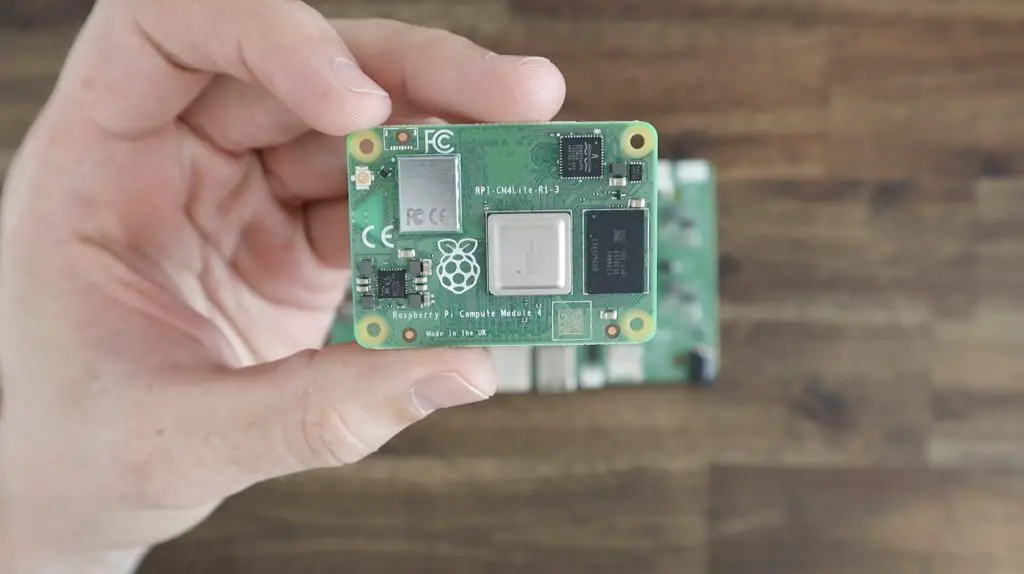
I’m using a variant with 8GB of RAM as well as WiFi and Bluetooth connectivity. There is a pretty broad range of these CM4 modules available and some are more common than others. There is also a shortage of these modules at the moment due to the global silicon shortage, so they’re not all easy to come by.
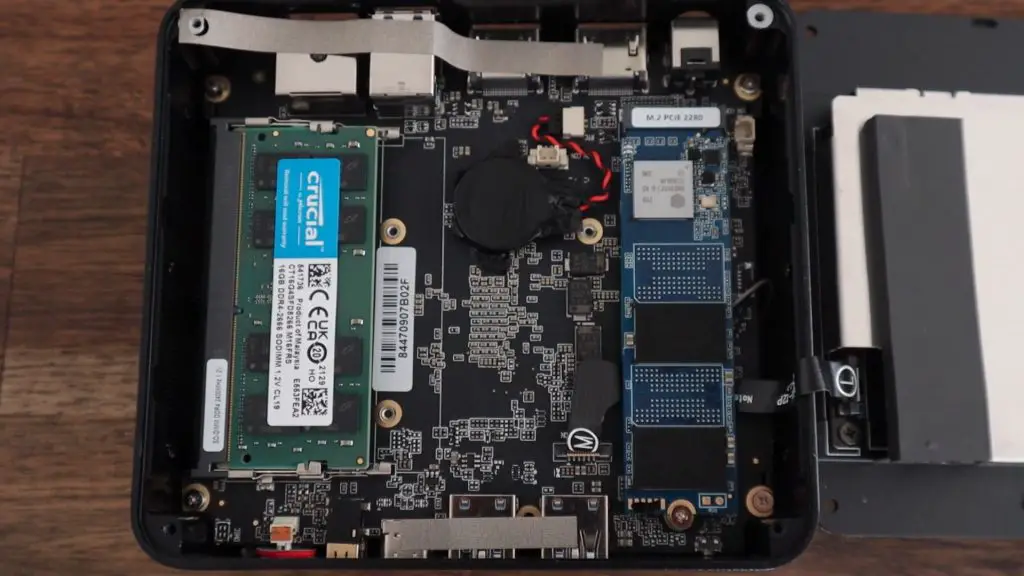
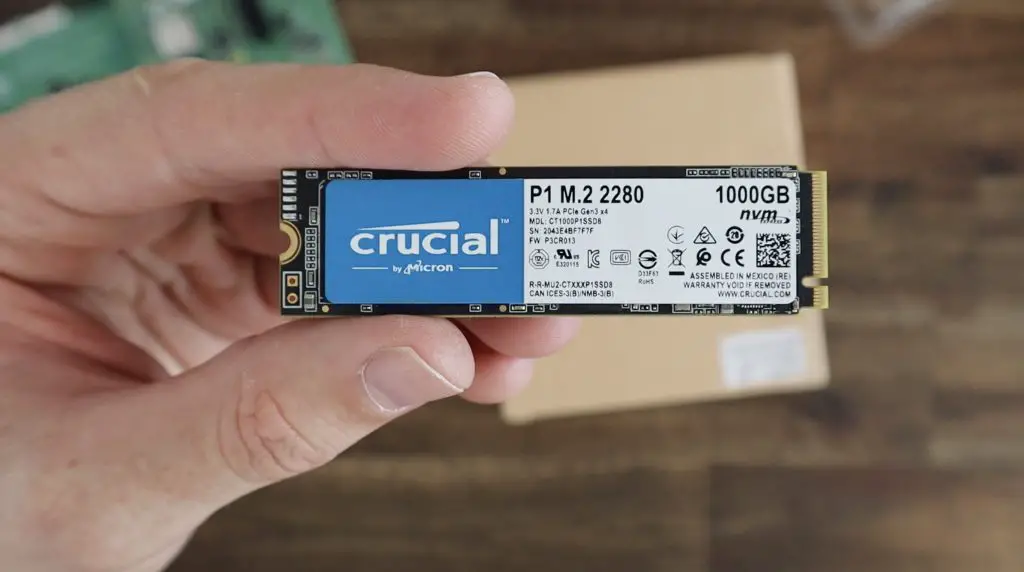
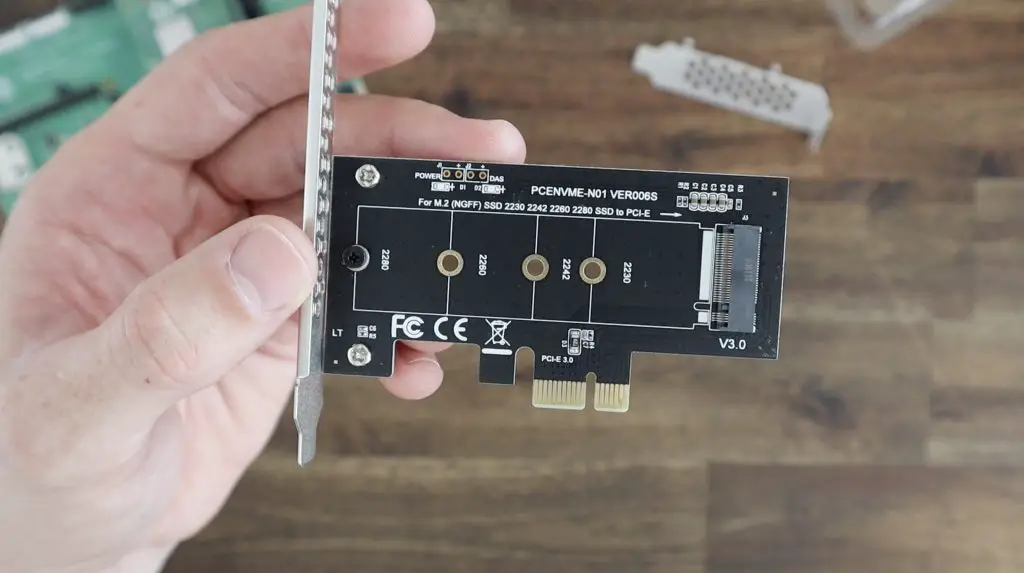
For storage, we’re going to use a 1TB Crucial NVME drive which we’re going to connect to our Pi’s PCIe Gen 2 x1 Socket using an M.2 to PCIe adaptor.
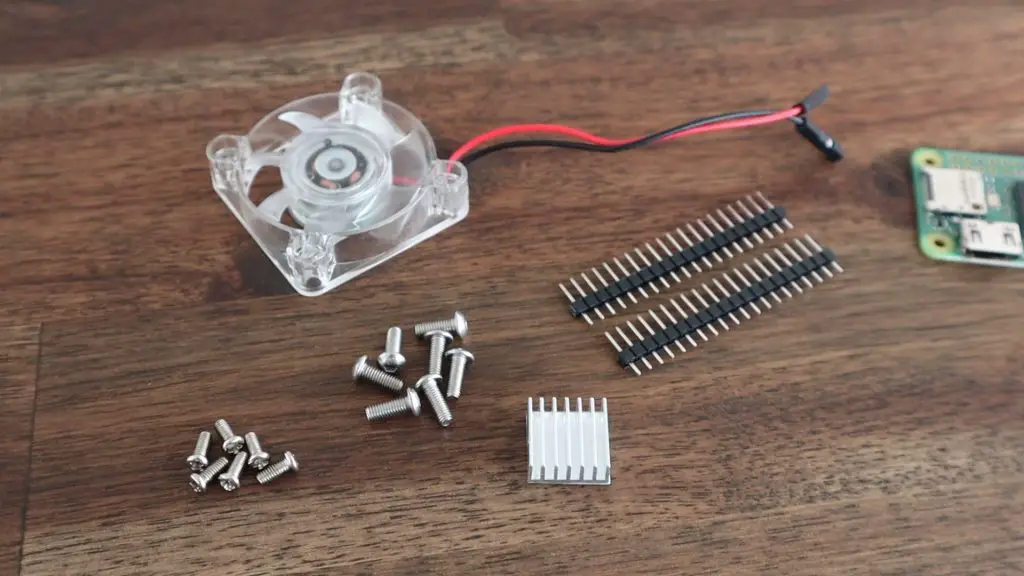
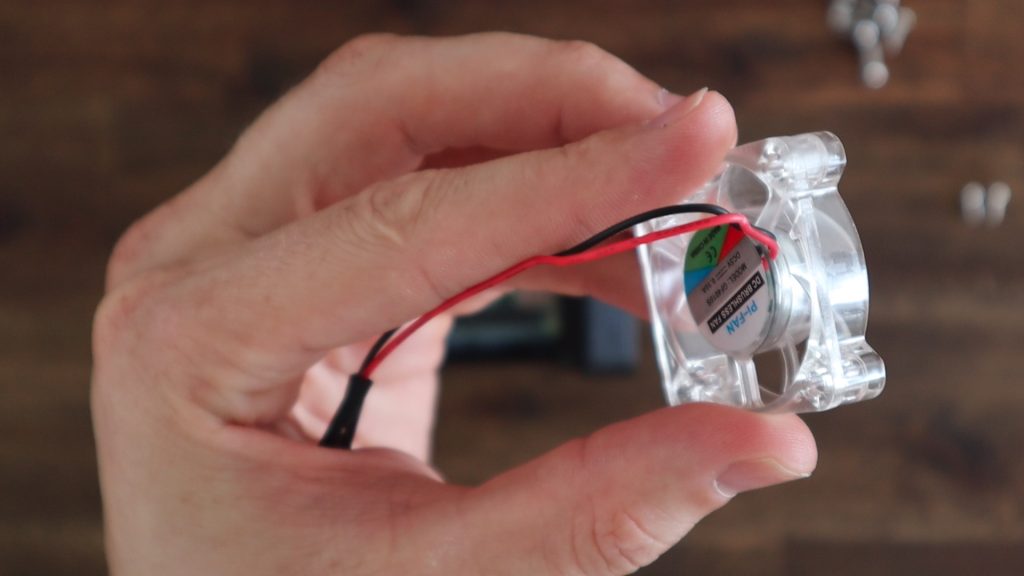
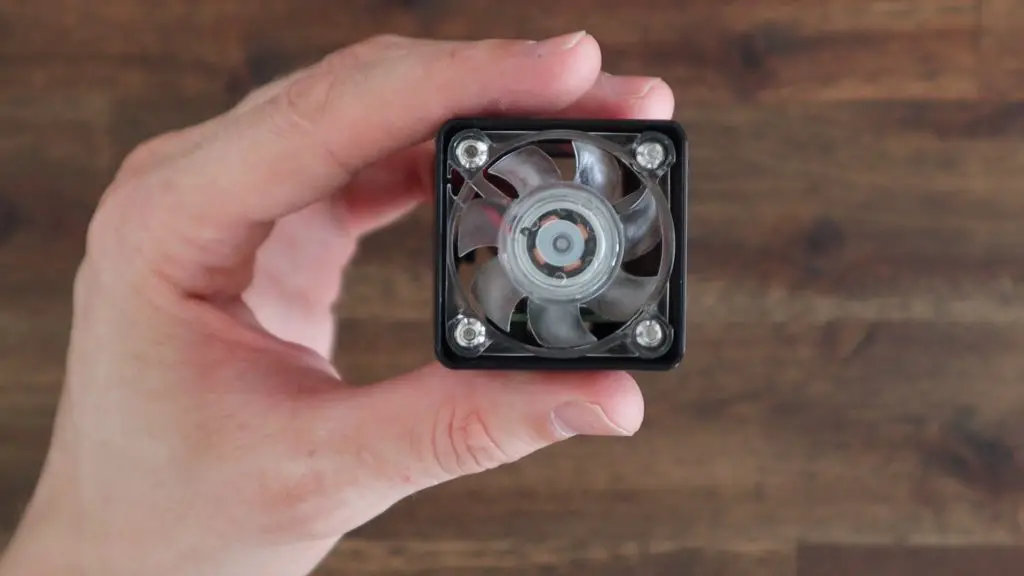
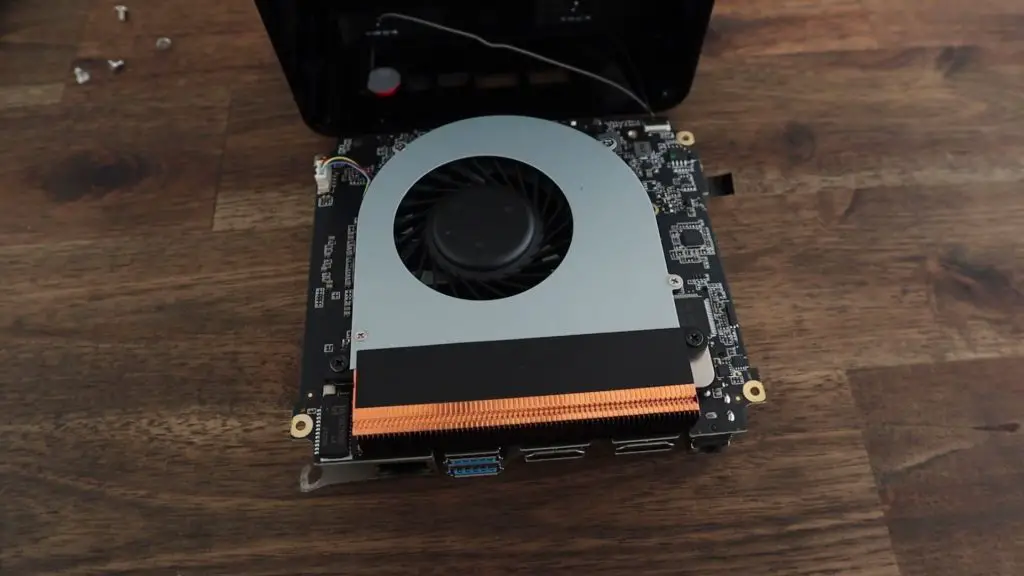
For cooling, we’re going to use a 60mm Noctua NF-A6x25 FLX fan which I’m pairing with a 60mm radiator.
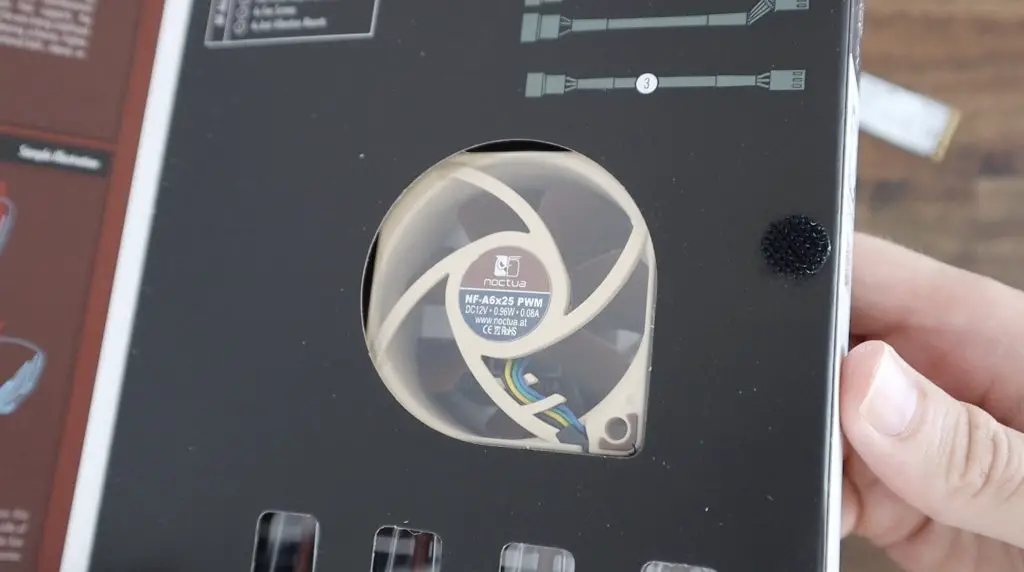
The 120mm one I used on my previous desktop build was obviously way bigger than necessary, and this is the smallest radiator I could find.
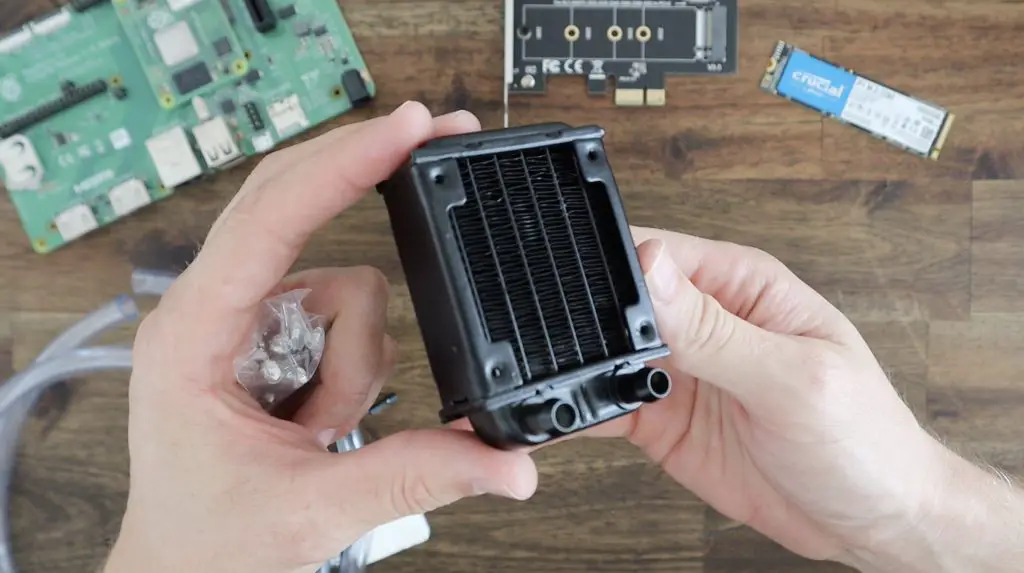
We’re going to use the same 40mm cooling block that I used previously as it fits over the CM4 module as well.
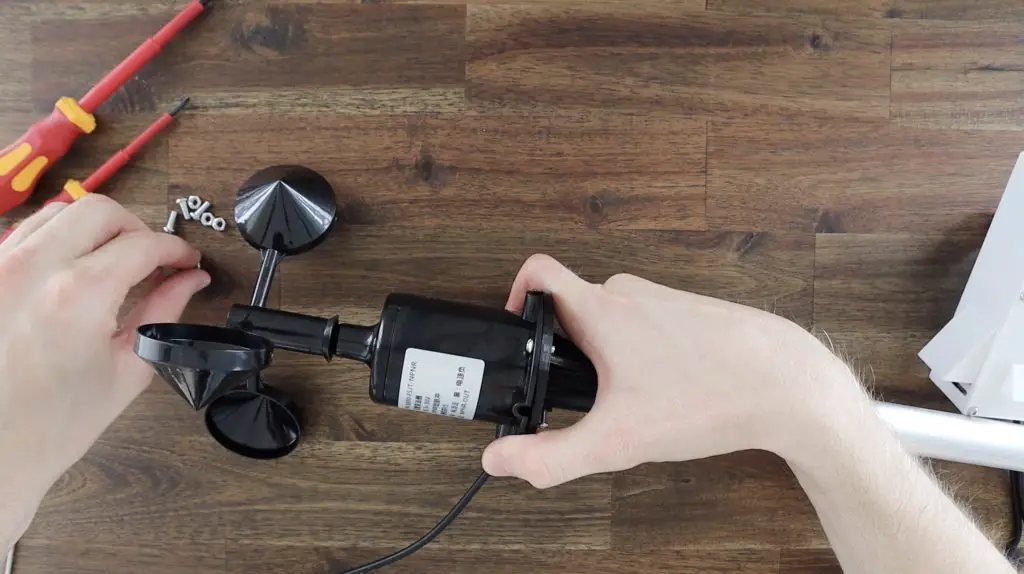
To move the coolant around, we’re going to use a small 5V pump, which I’m hoping I can run on 3.3V so that it is a bit quieter. I’m going to need to build a small reservoir for coolant storage and we’ll connect the components together with some clear flexible tubing.
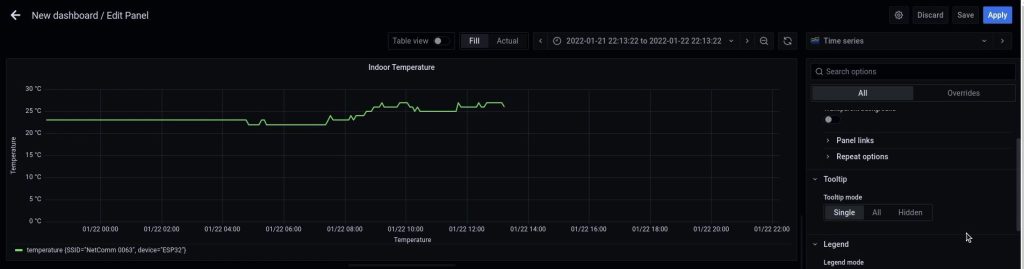
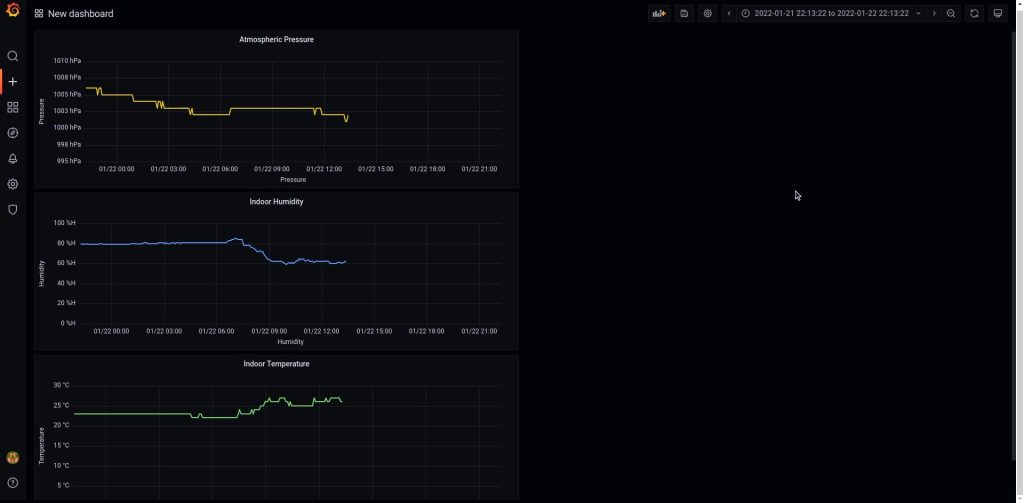
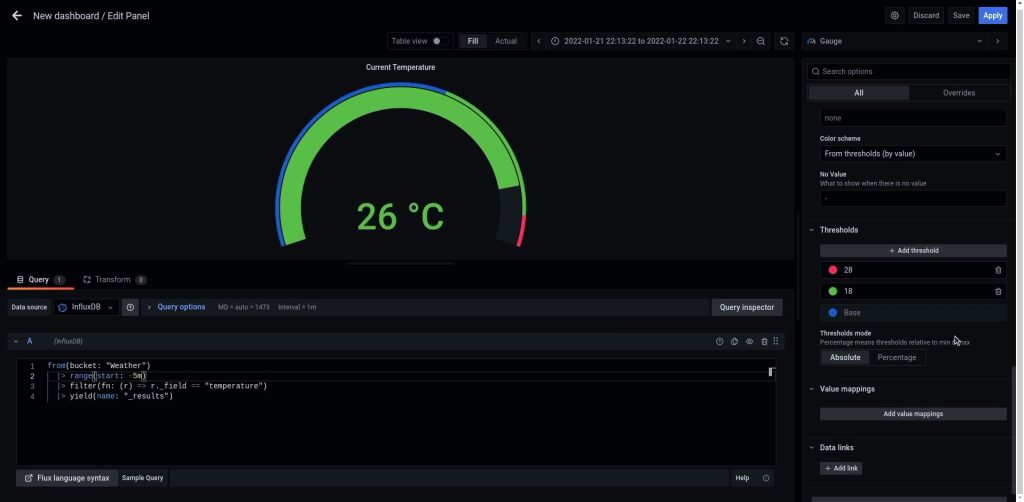
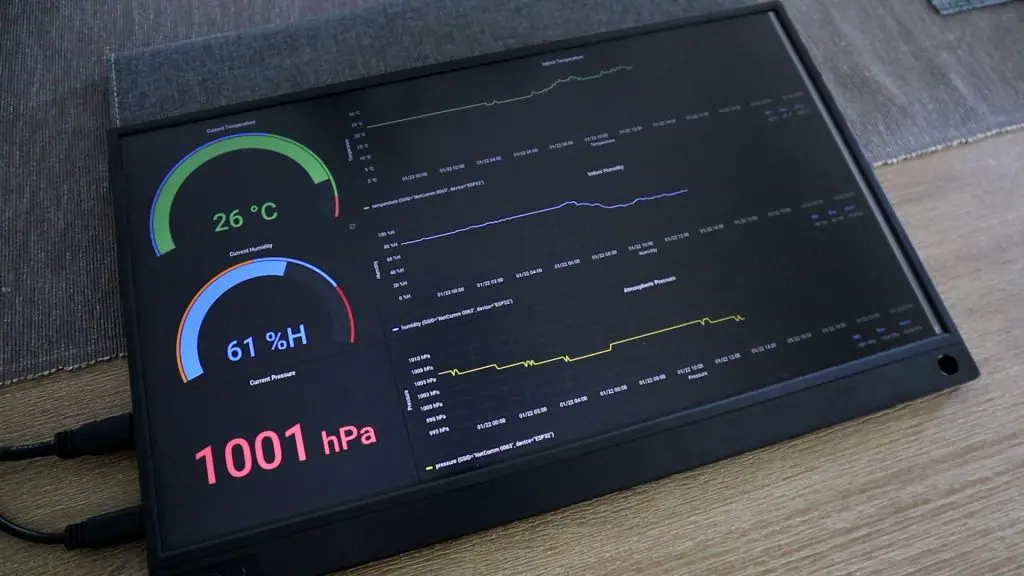
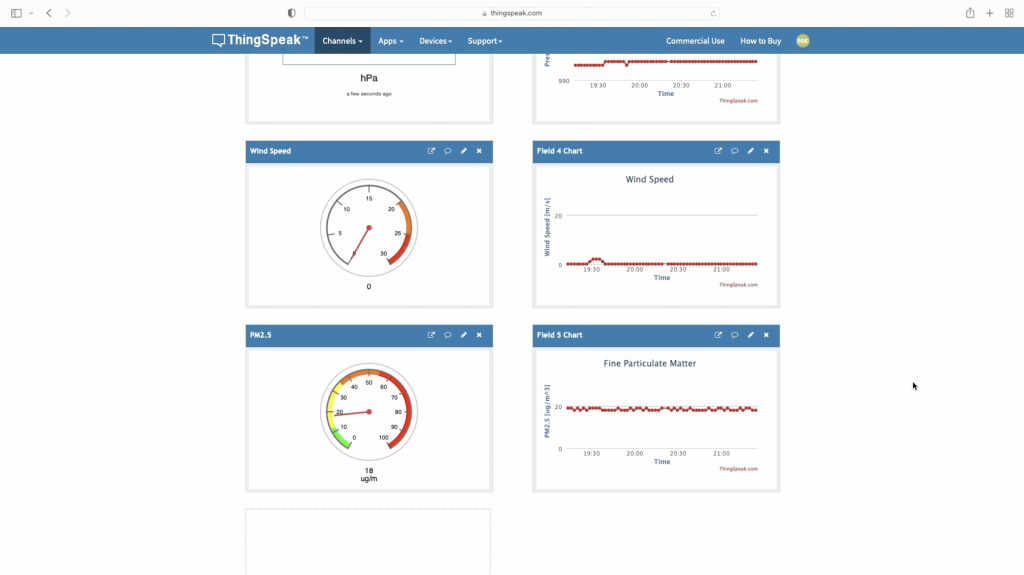
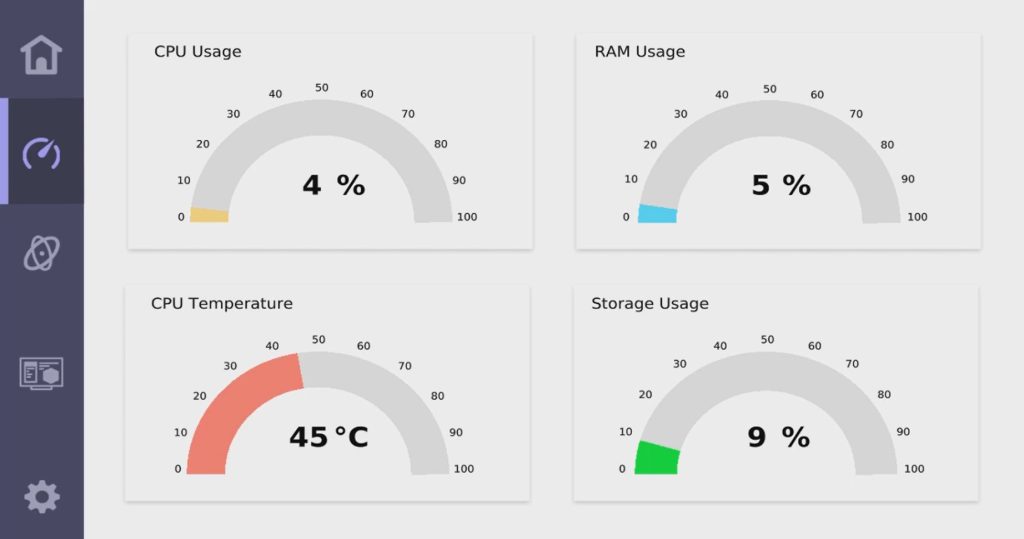
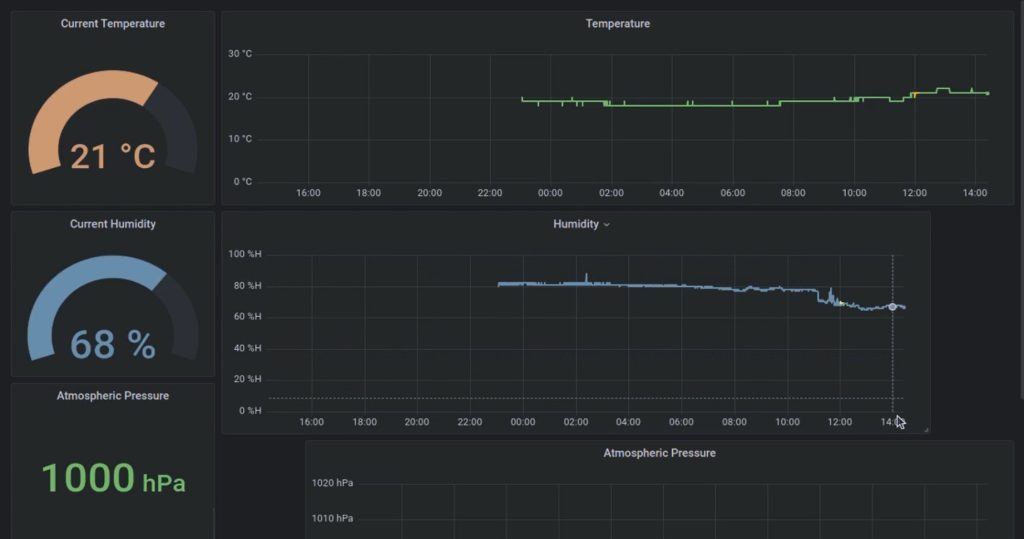
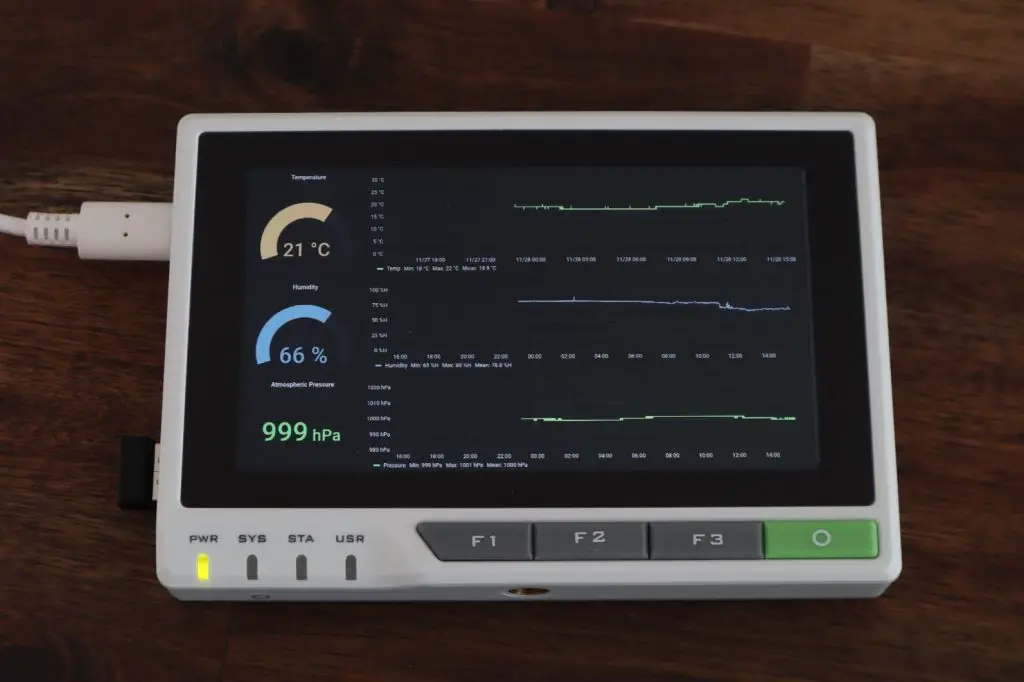
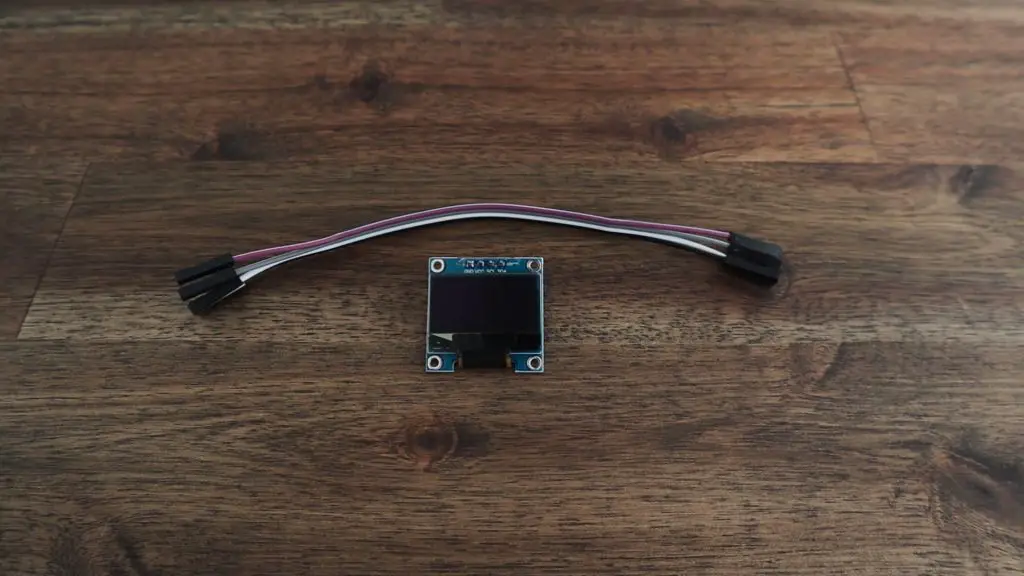
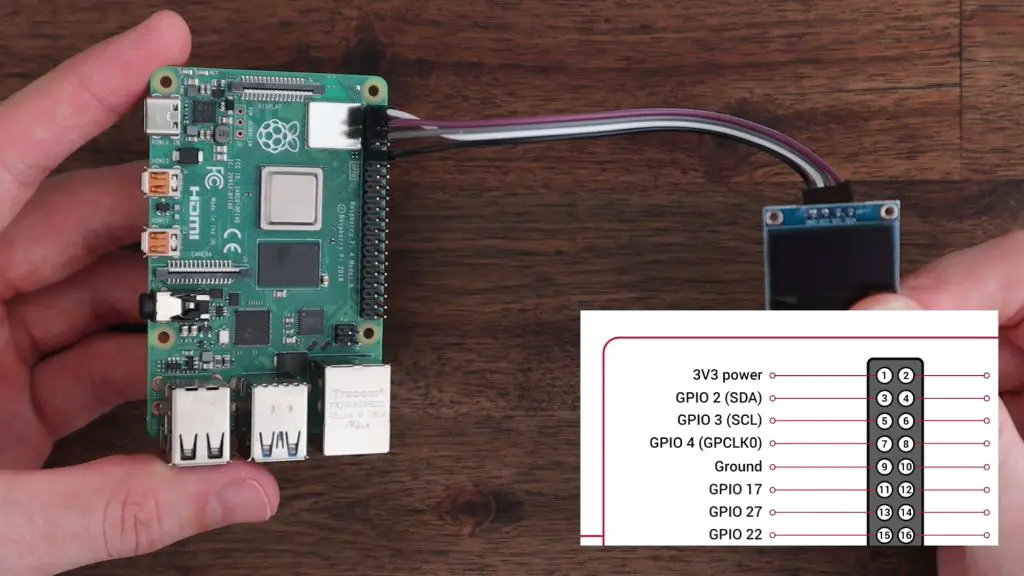
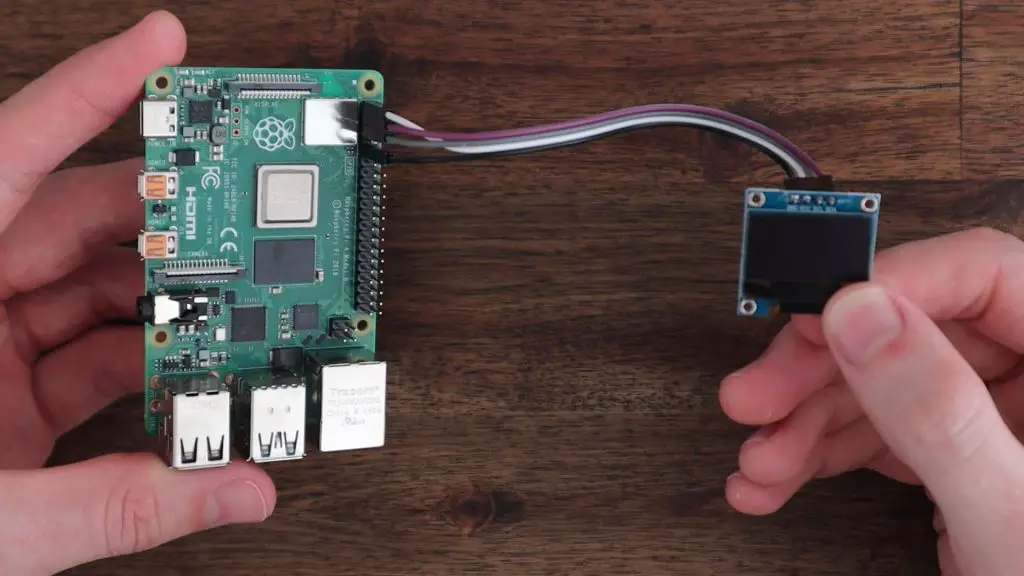
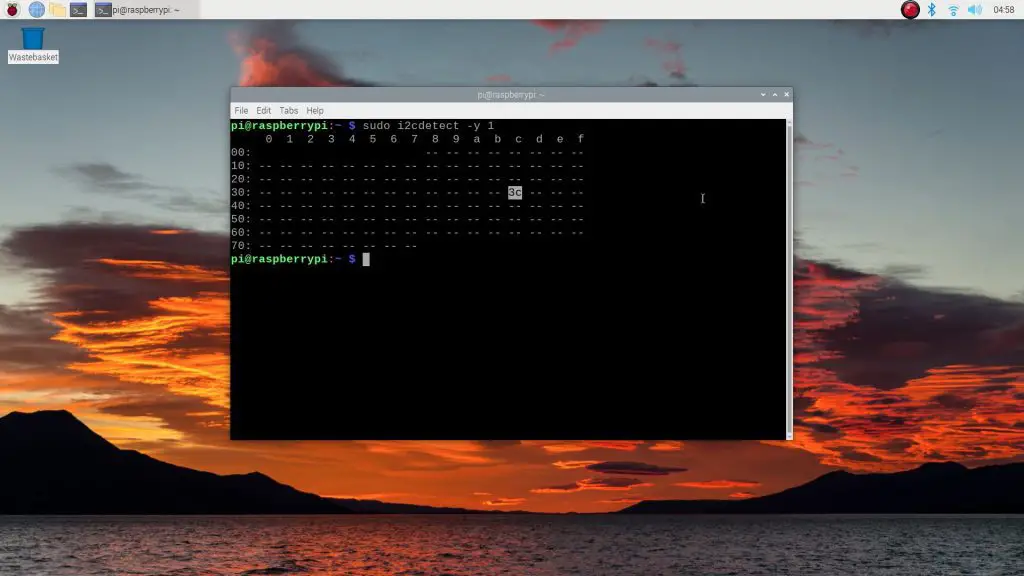
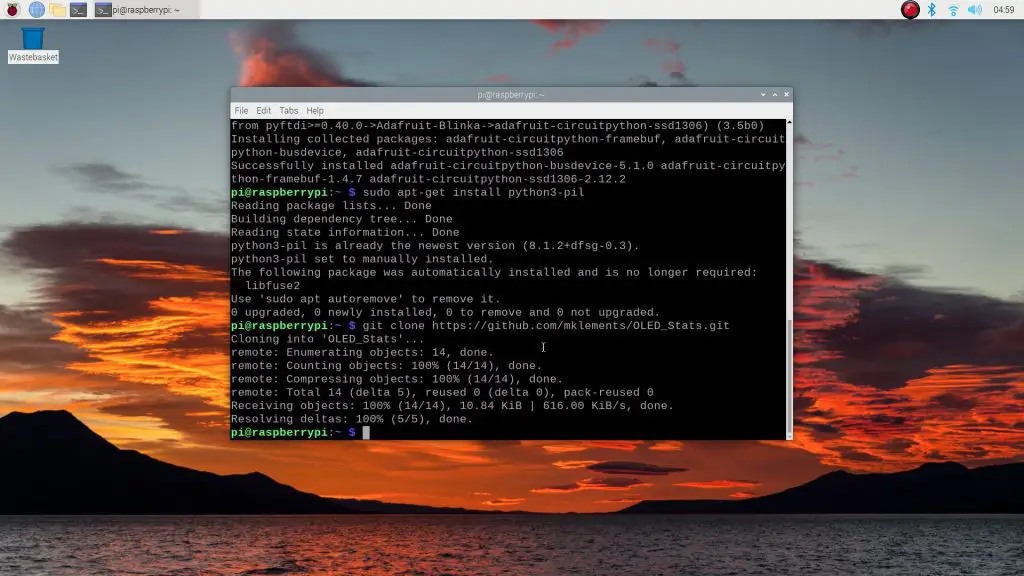
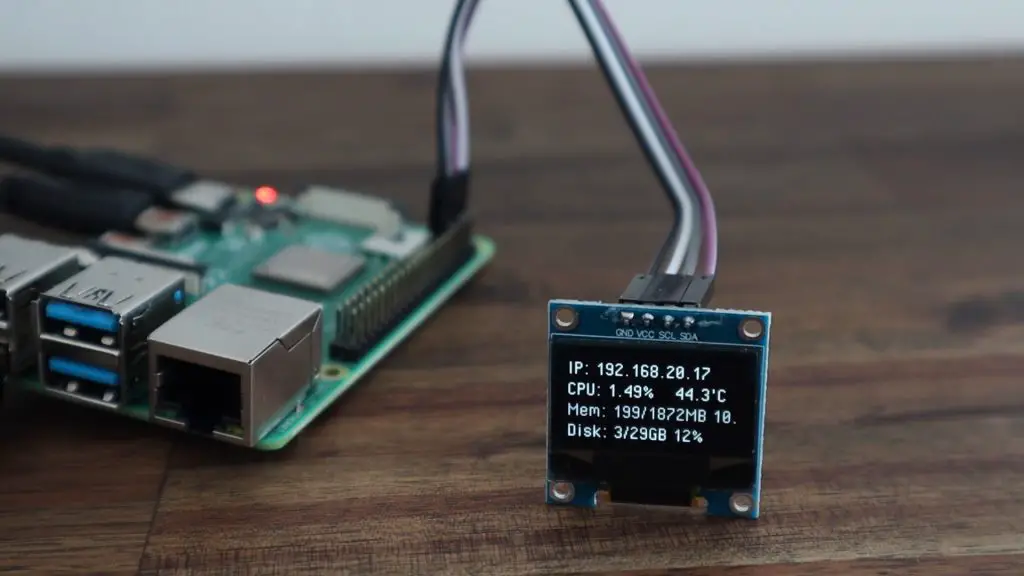
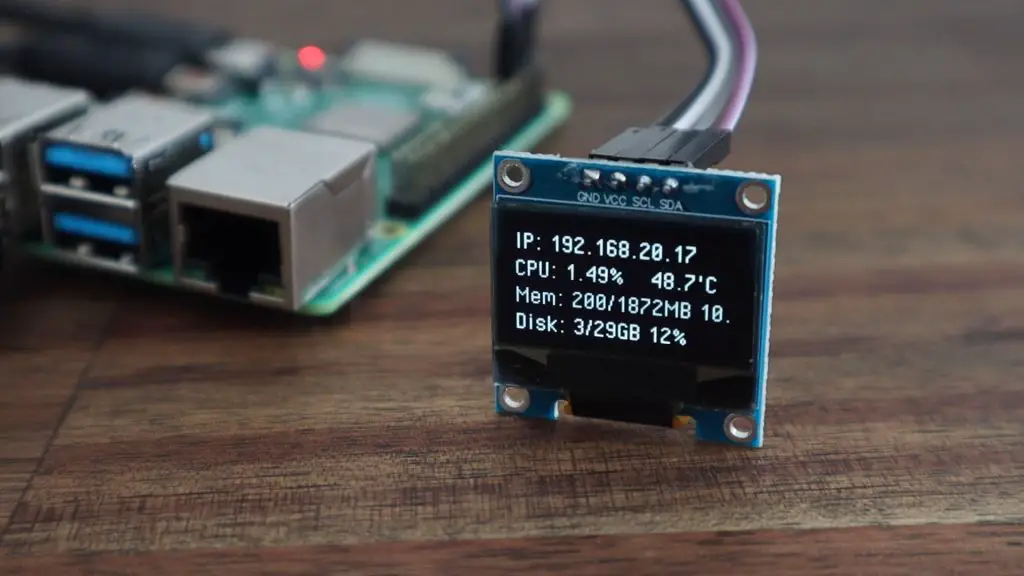
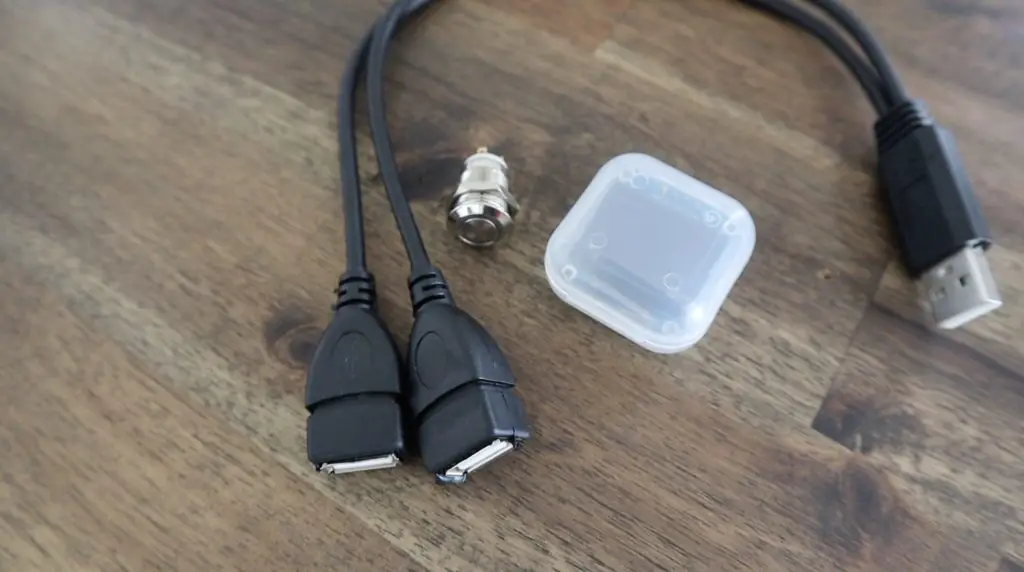
On the front of the case, I’m going to add an I2C OLED display as I’ve done on a lot of my other case builds to display the IP address and some stats. I’m also going to add a power button, which I’ve chosen with a LED ring light around it which will light up when the computer is on. And lastly, I’m going to add two front-facing USB ports. I couldn’t find ones with four female pins on them locally, so I’m just going to cut up this splitter and put my own Dupont connectors onto each of the leads.
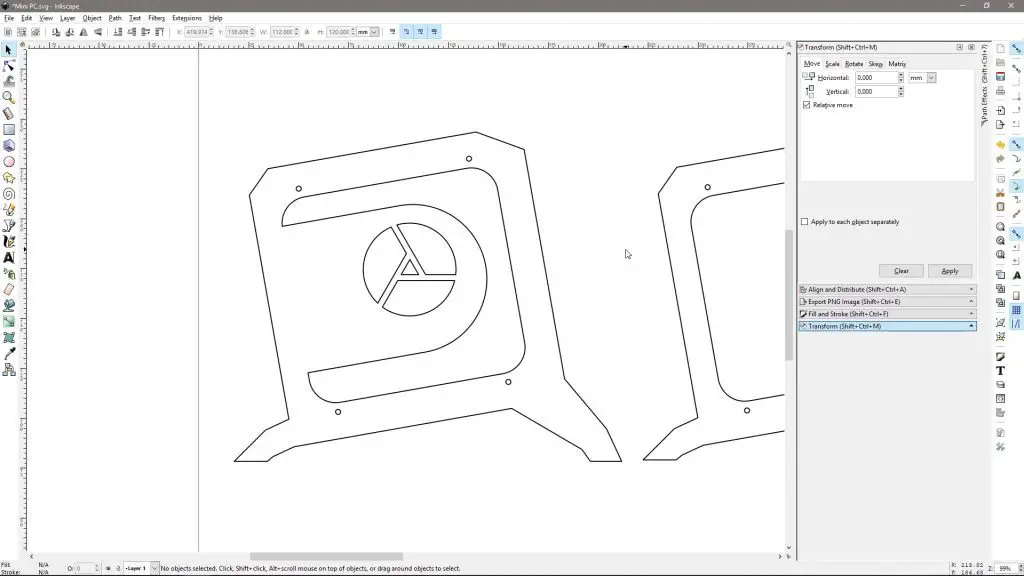
Designing The Acrylic Case
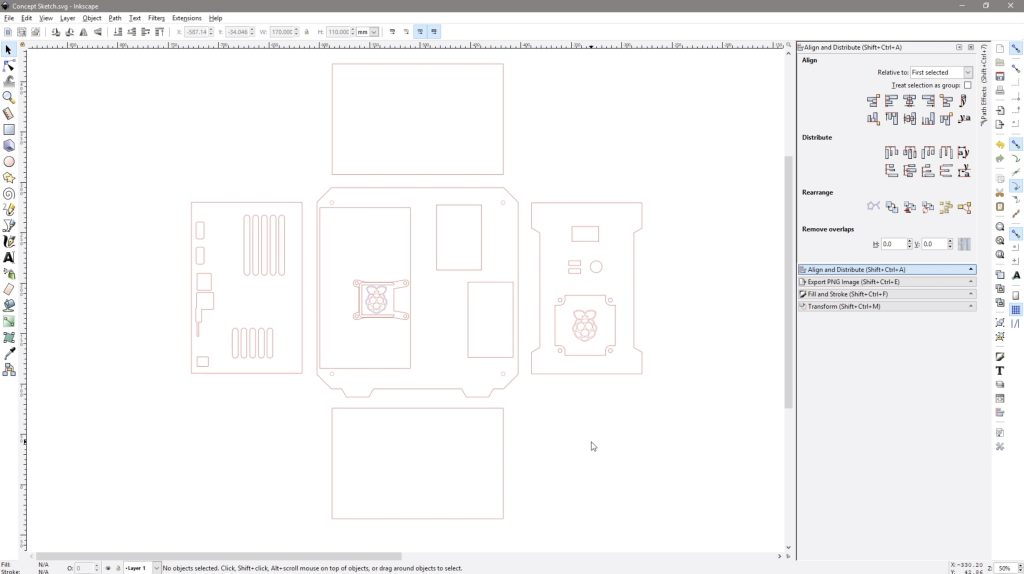
Now that we know what hardware we’re going to be using, we can move on to designing a case to house it all. I designed the case in Inkscape using my previous builds as inspiration. Inkscape is open source and is great for producing 2D part designs for laser cutting.
Download the CAD files to make your own case.
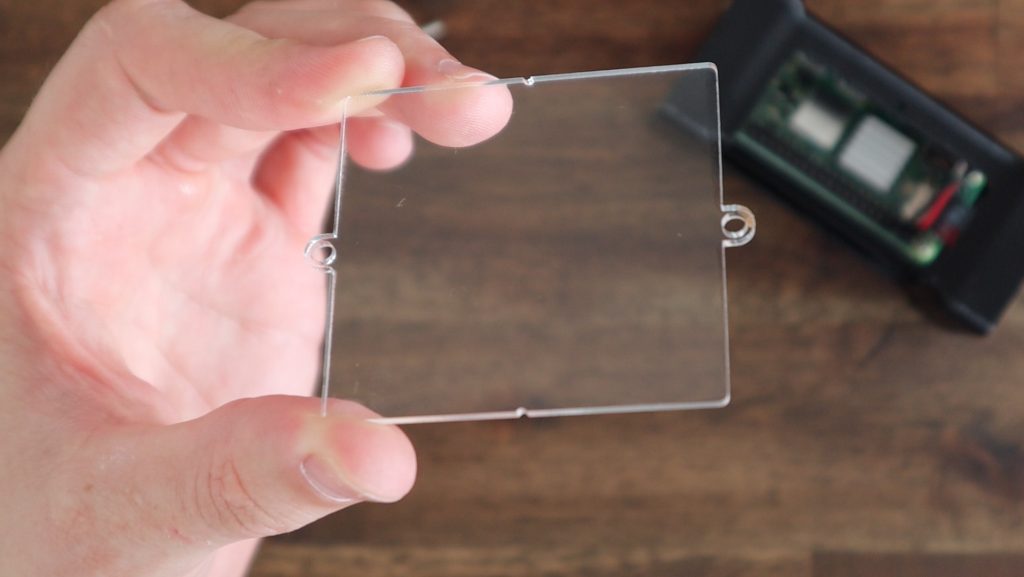
Five of the sides of the case will be cut from 3mm matt white acrylic, and the other main side panel will be clear acrylic so that the internals are all visible. I’ve then got two small black acrylic accent pieces for the front panel and I’ve designed a new water cooling block bracket to keep the block positioned directly over the CM4 module’s CPU.
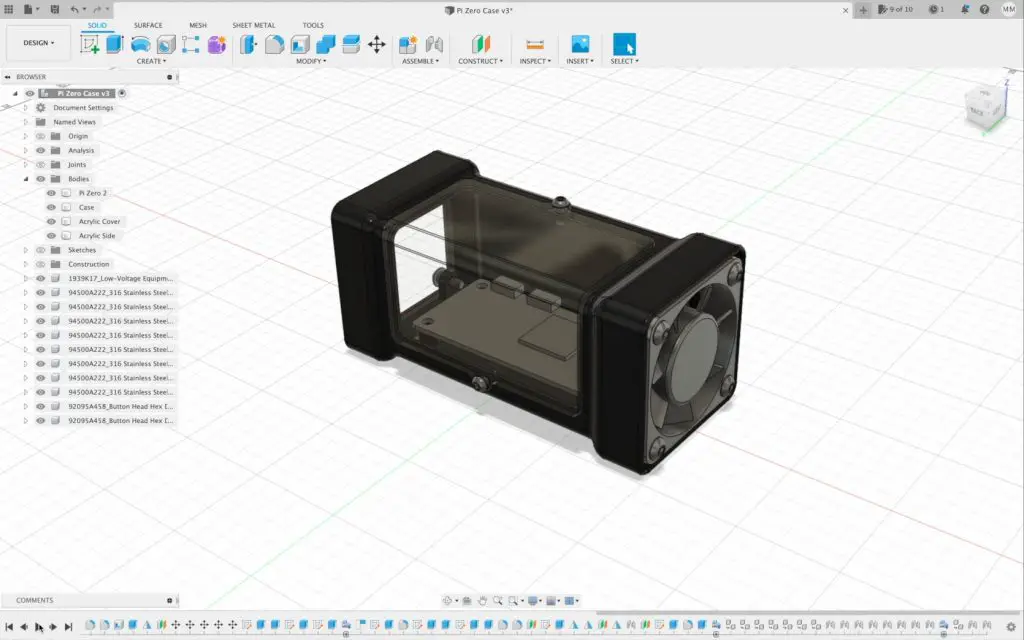
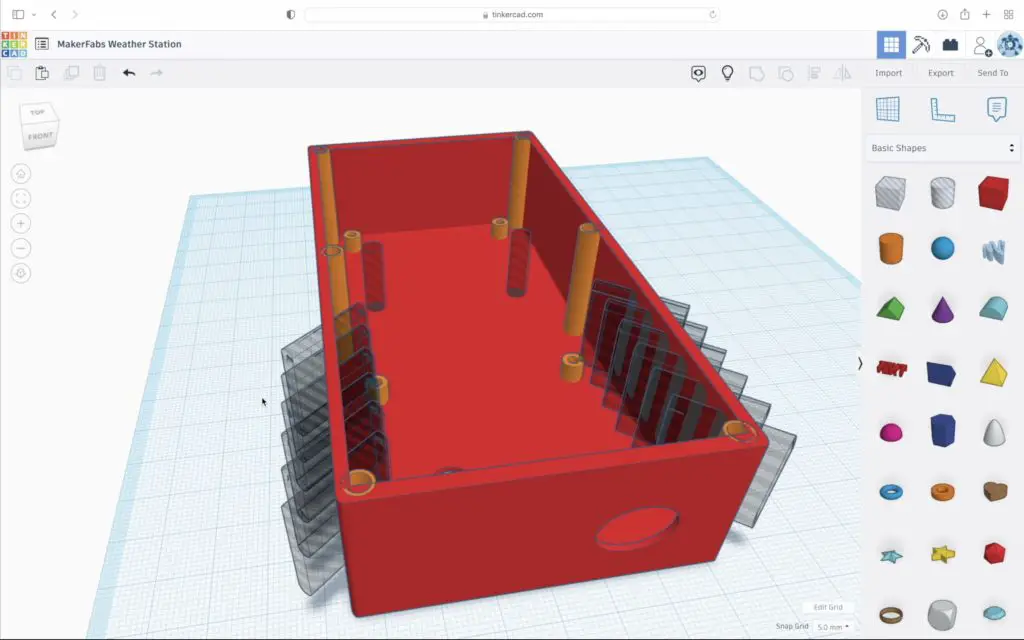
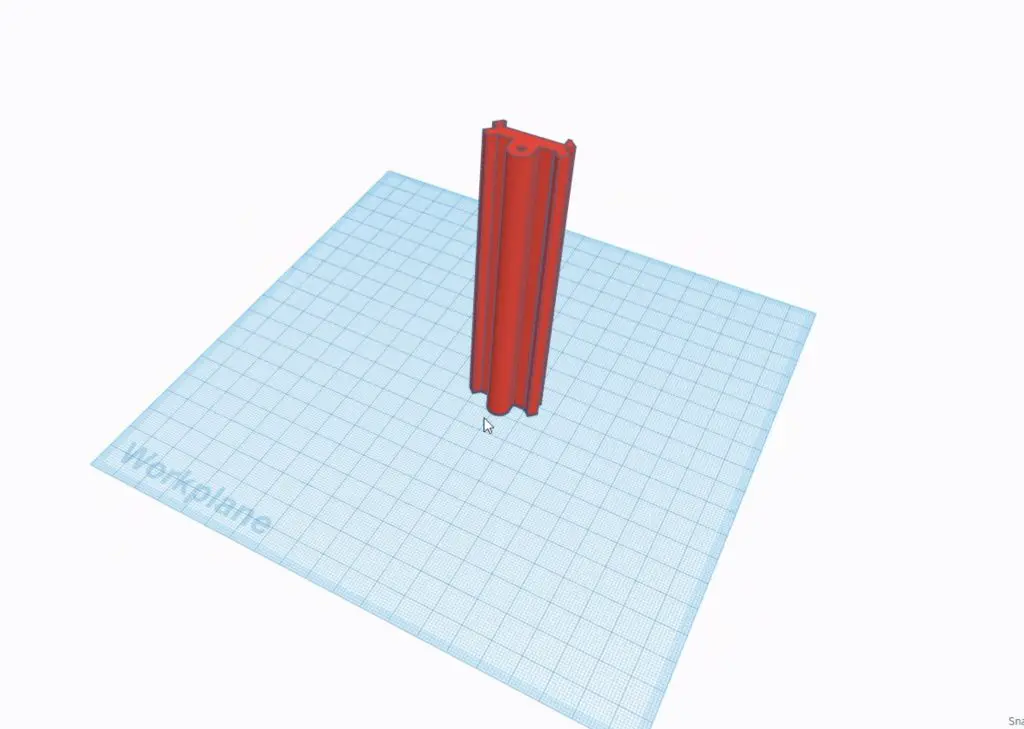
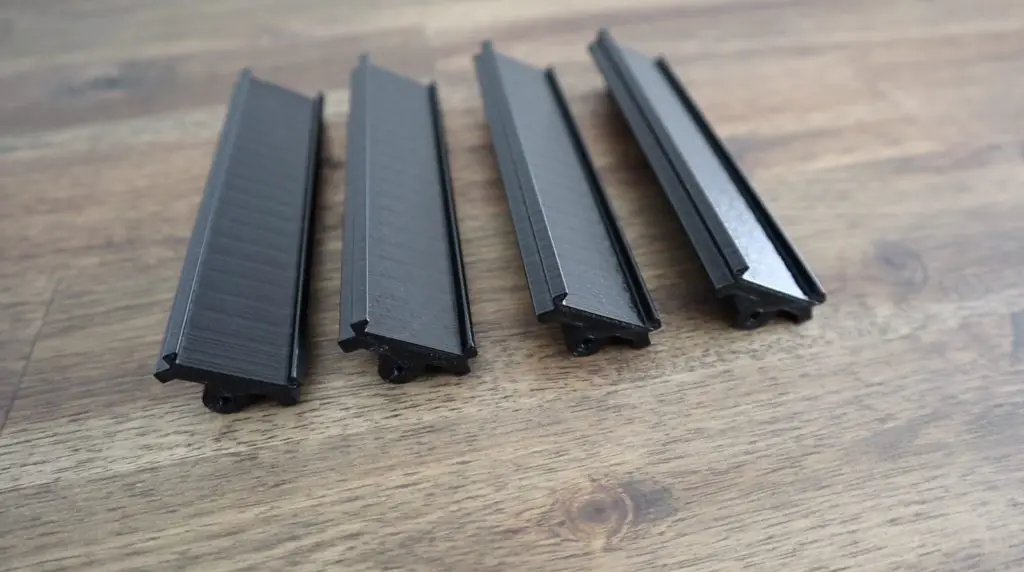
Acrylic doesn’t join very well at 45-degree angles (unless you mitre the edges) and I don’t like 90-degree edges on all of the sides as it starts to look too “boxy”. So I designed some corner sections in Tinkercad which I’m going to 3D print. Tinkercad is a free, browser-based basic CAD package that works by combining or removing shapes to form 3D models. These corner sections will support the side panels and hold another section of matt white acrylic along the 45degree edge as an accent piece.
I sketched up the rest of the case in Tinkercad as well to get a feel for what it would look like and made some tweaks to the design along the way.
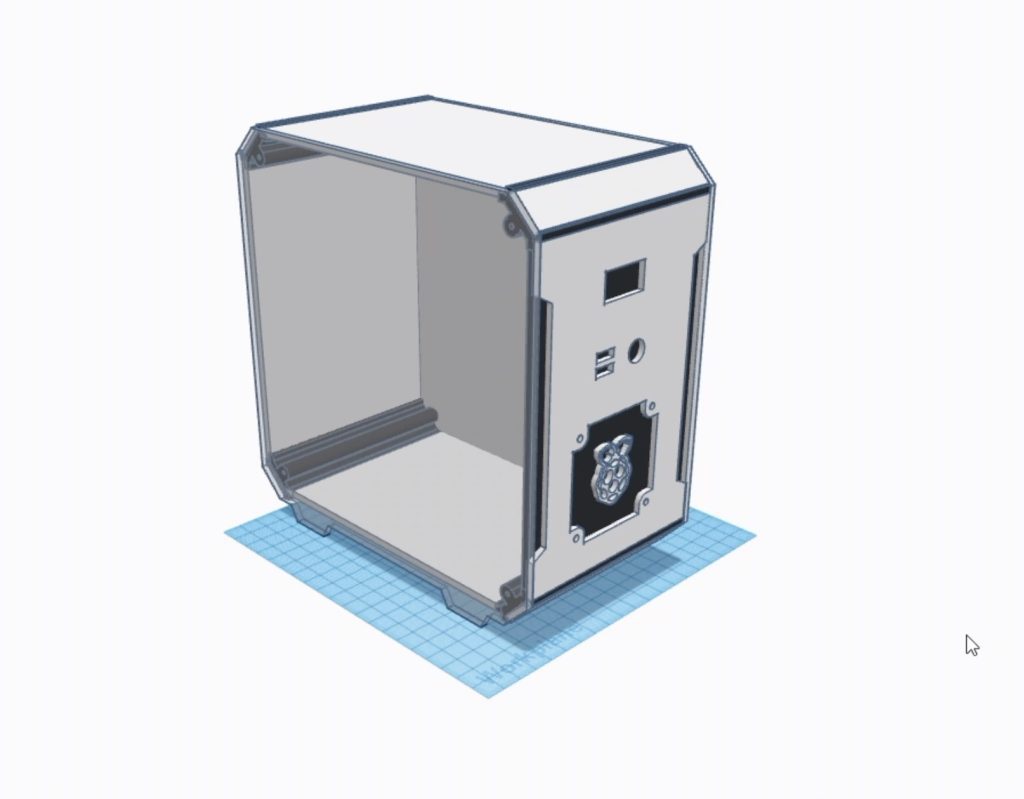
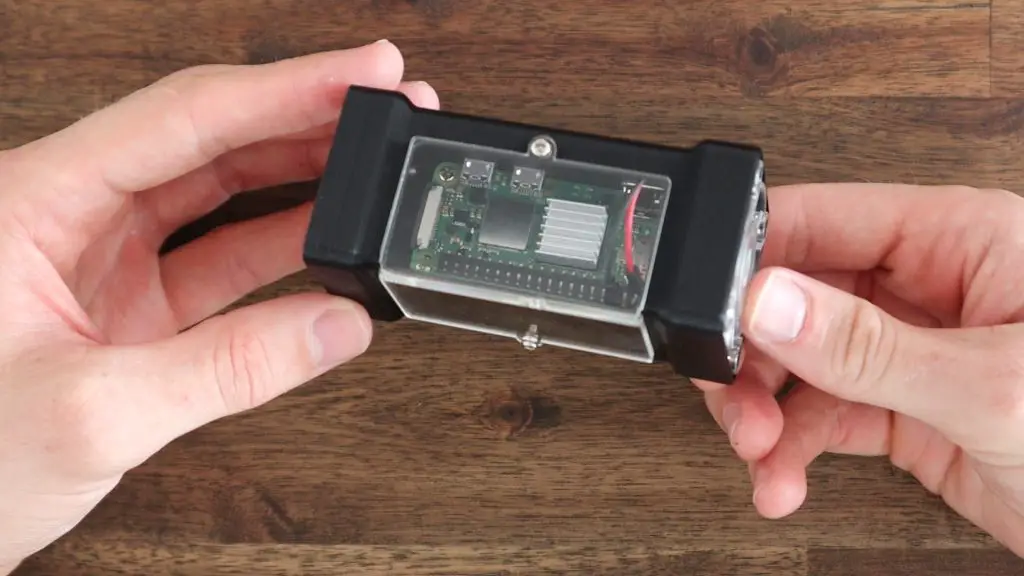
I was a bit undecided about framing the clear acrylic side with a white acrylic border as well, but I think it looks better being entirely clear.
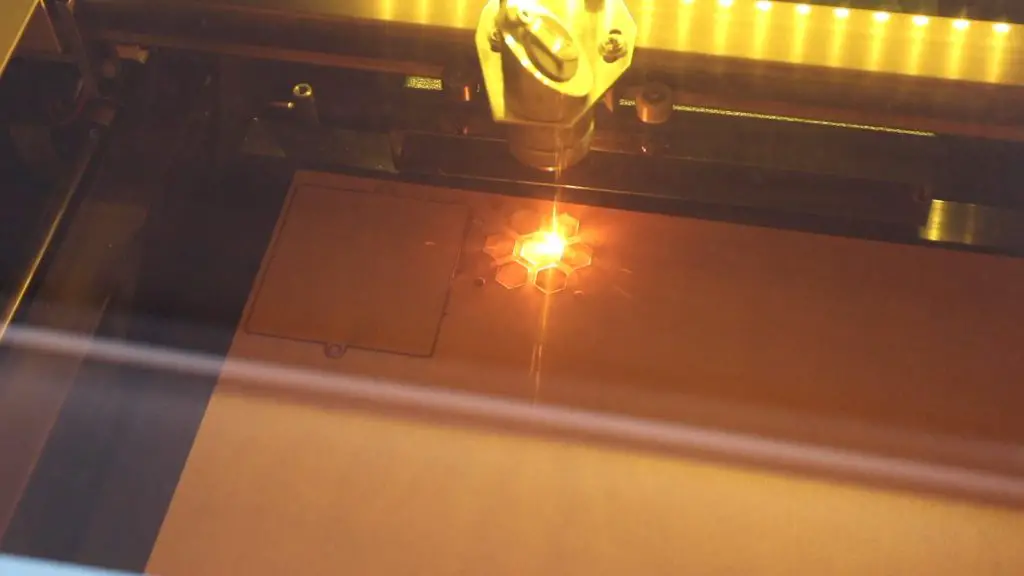
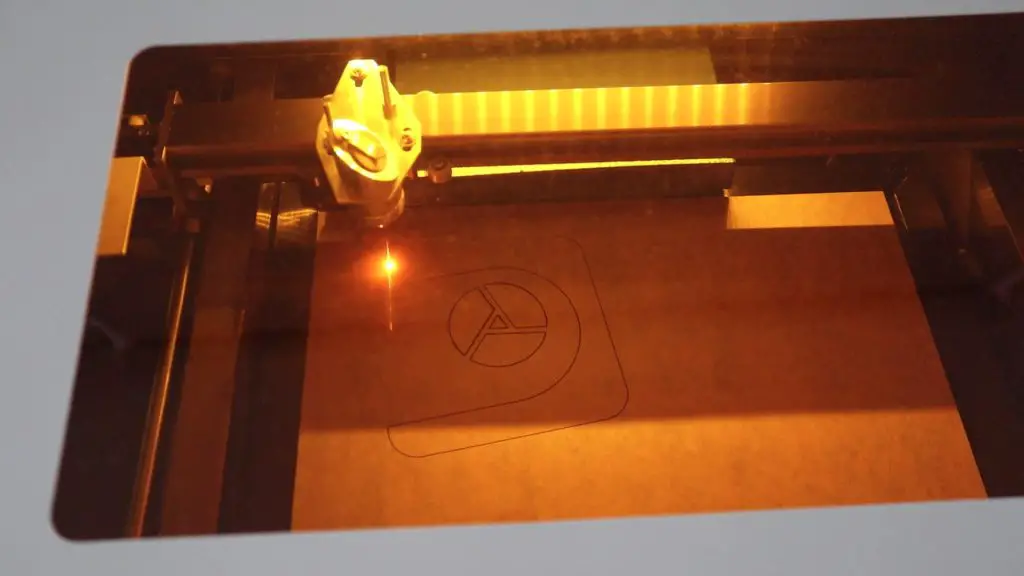
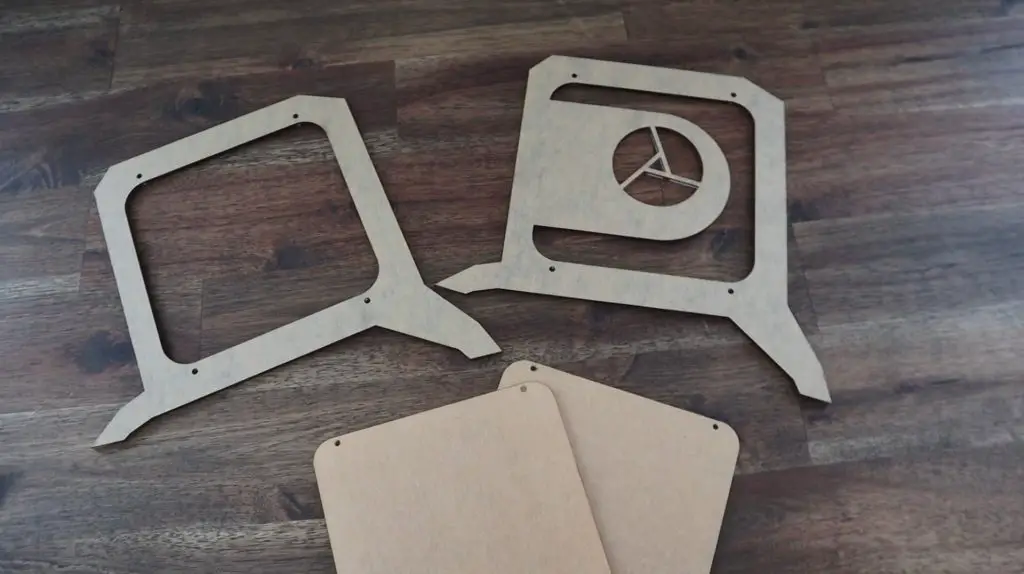
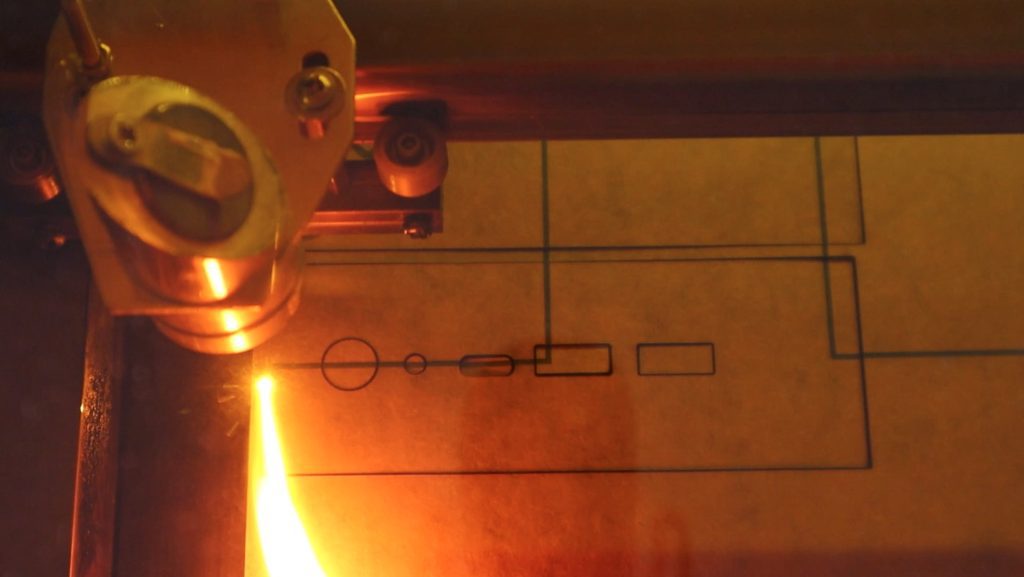
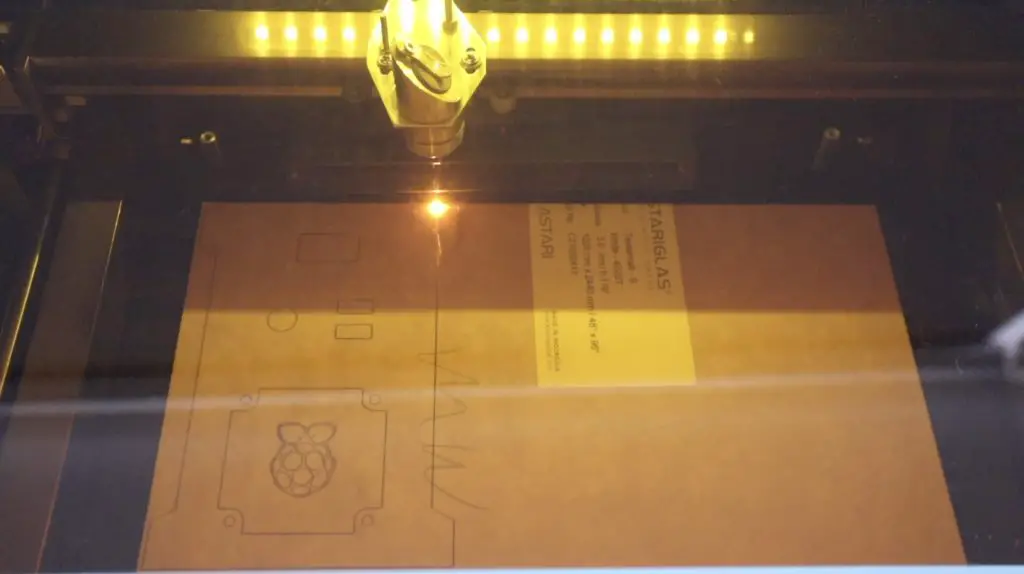
Cutting & Assembling The Case
With the design done, let’s cut the acrylic parts out on my laser cutter. I’m using a K40 laser cutter, which is a fairly generic name for a range of 40W desktop CO2 lasers that are available from a number of manufacturers, particularly in China. They’re quite inexpensive and work well for cutting and engraving thin acrylic and wood.
With the acrylic cut, we can start assembling the case.
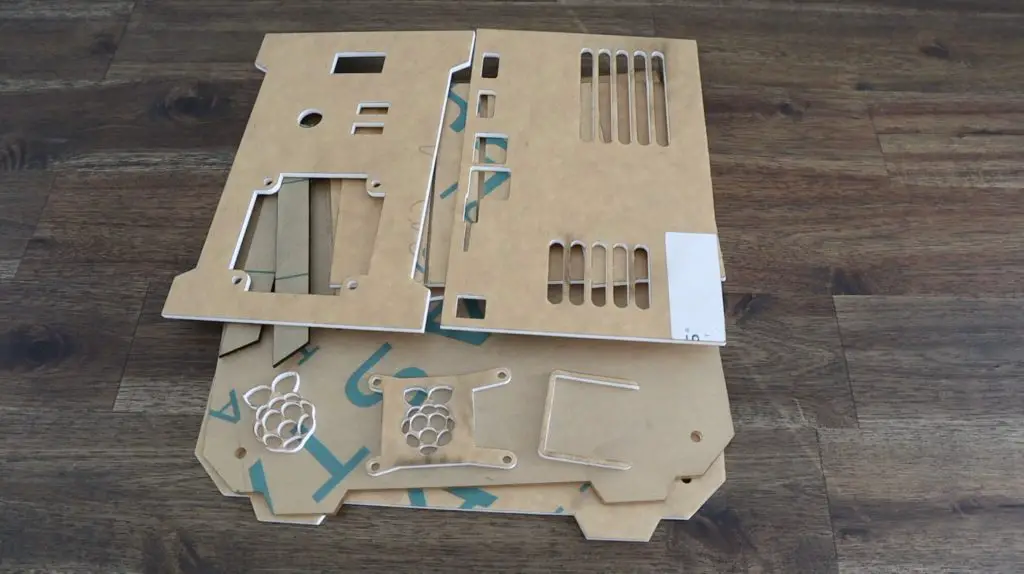
I’m going to peel off the protective film on the inside face of each piece, but I’m going to leave as much of the outside film in place as possible so that it doesn’t get dirty or scratched while assembling it.
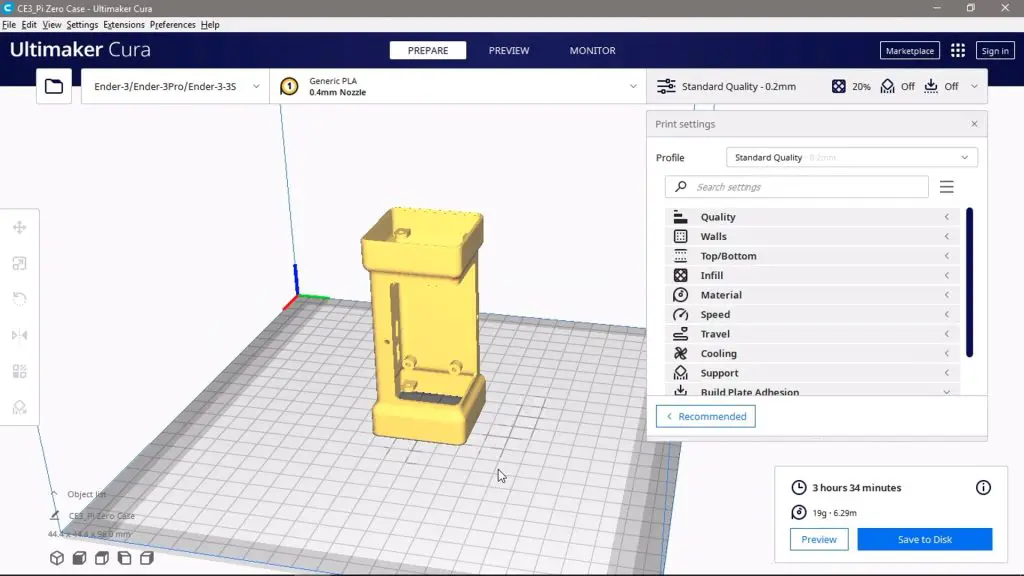
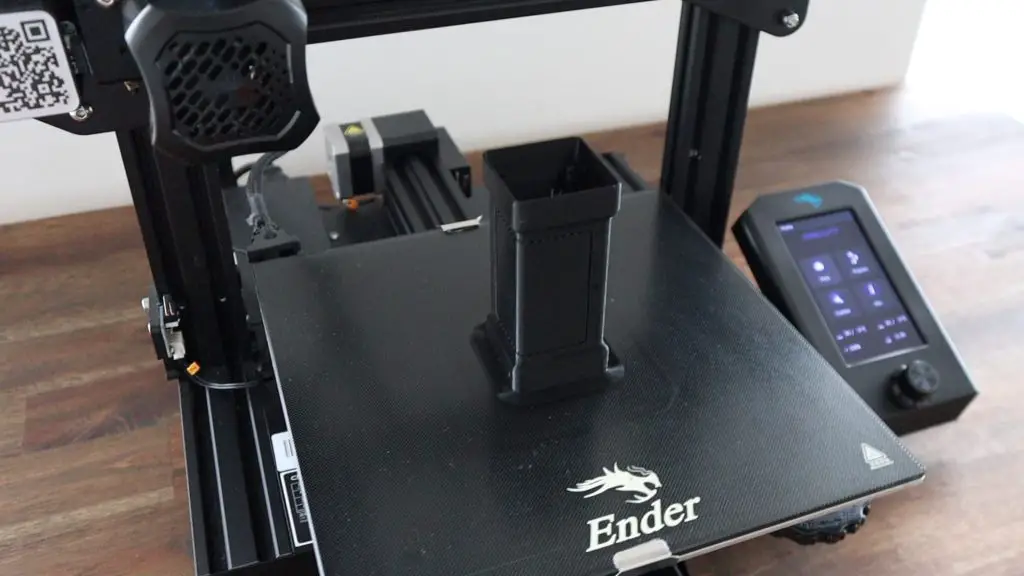
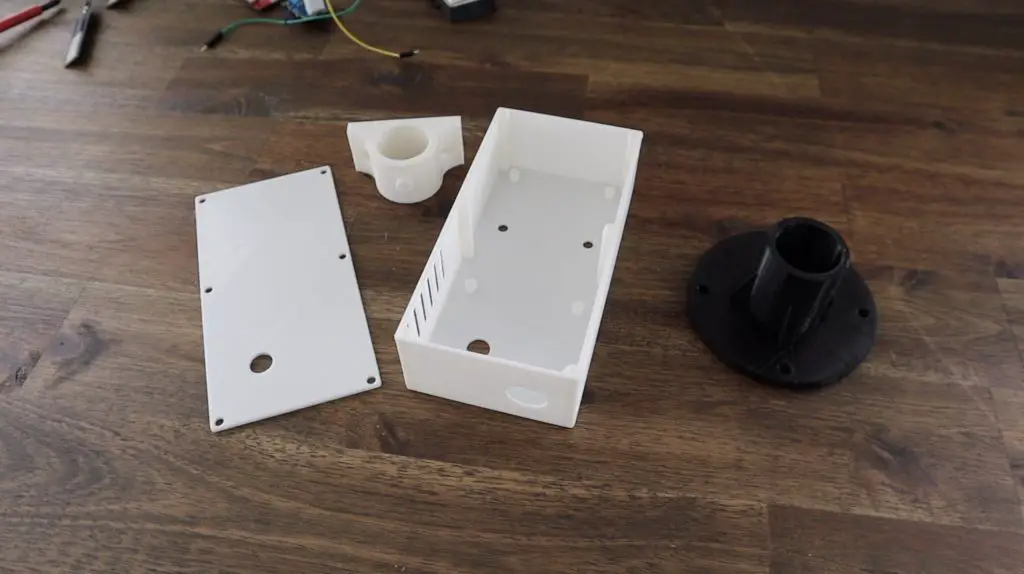
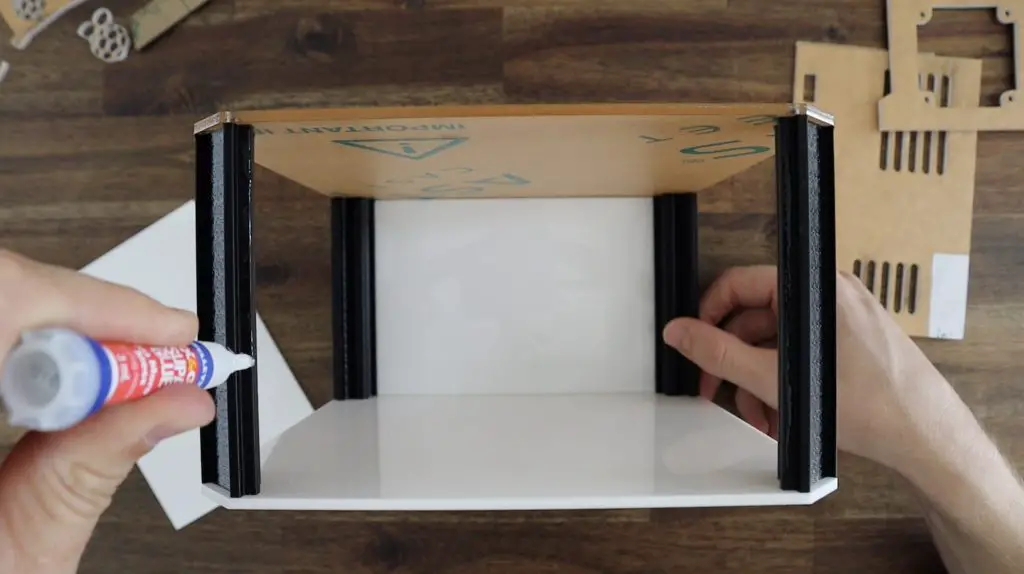
Let’s start with the main white side panel and add our 3D printed corner pieces to it so that we can then glue the other four smaller side panels into place. I just printed the corner pieces out in black PLA on my Creality Ender 3 V2 using a 20% cubic infill.
One of these pieces will go in each corner and I’ll hold them in place with some black M3 button head screws. This will also allow me to remove the main clear side panel after it is built for maintenance.
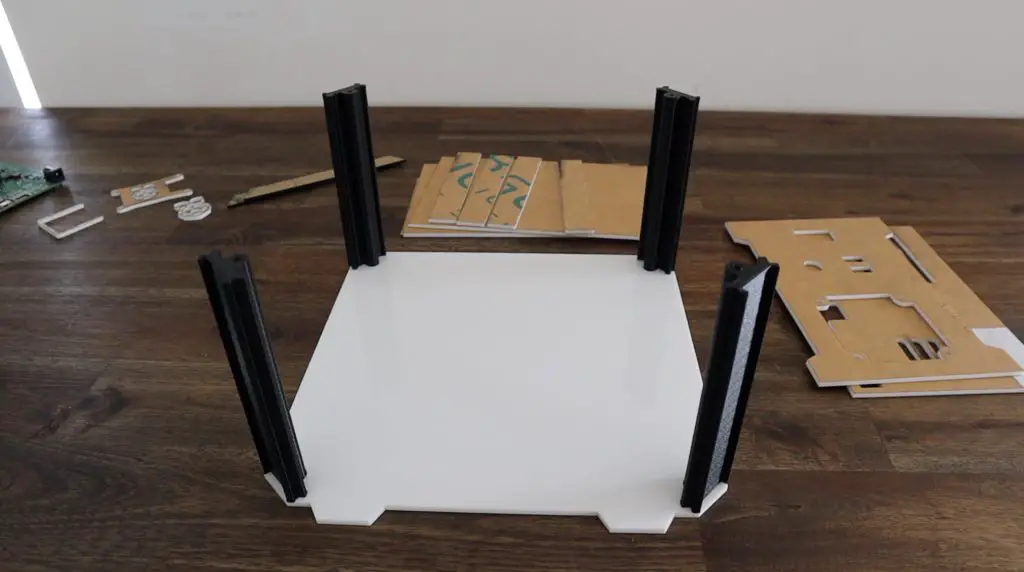
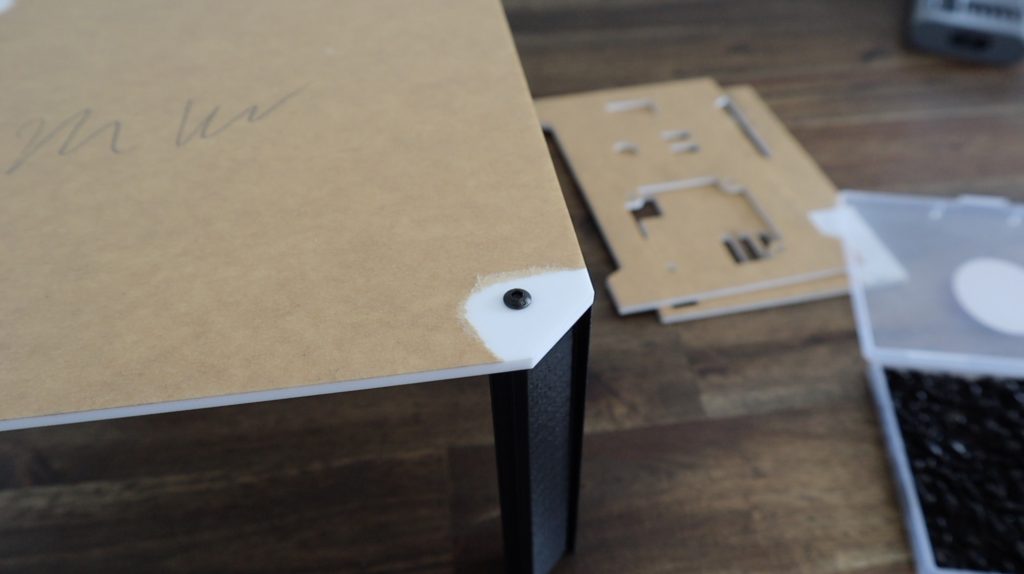
With that done, I’m going to also temporarily screw on the clear side panel to hold the corner pieces square while we glue the other edge pieces into place. This will give the whole case a bit of rigidity while we work with it.
To glue each of these pieces into place, I’m going to use some super glue. I don’t often use superglue, but it works well for bonds between acrylic and PLA and is quick and easy to use in this case.
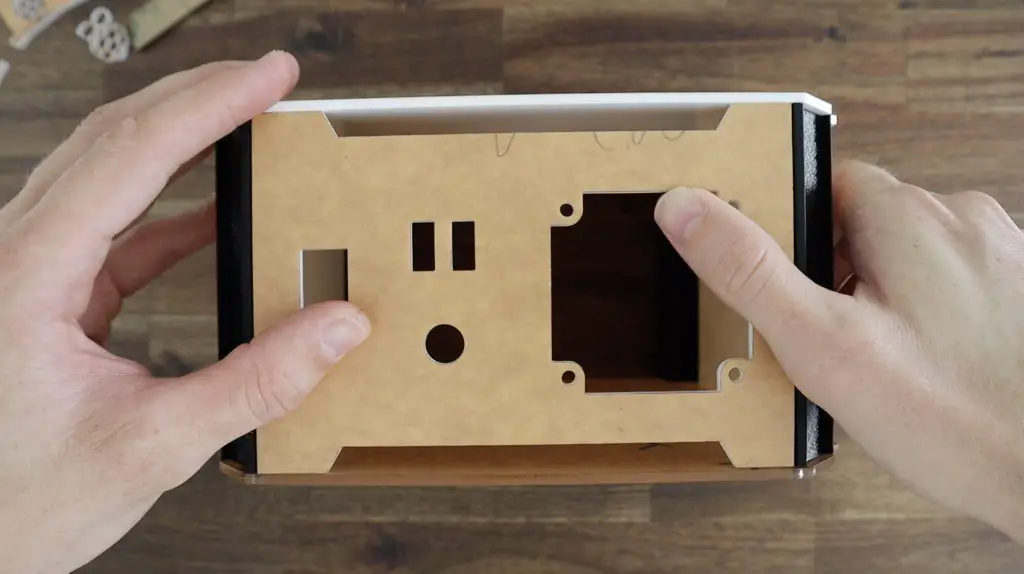
Once the four edge pieces are glued into place, we can remove the clear side panel and add the black accent pieces.

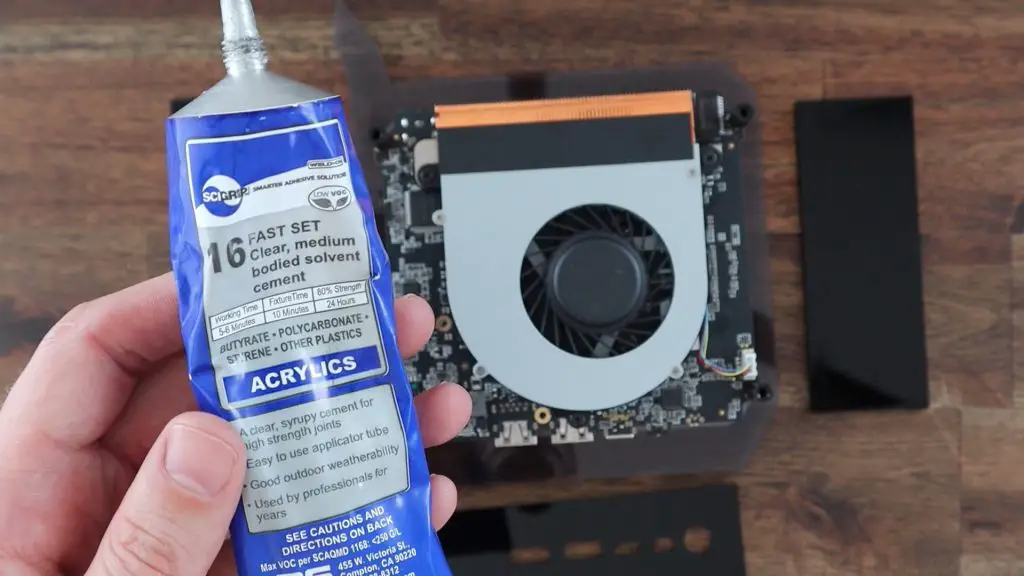
I’m going to use weld-on 3 to glue these into place. This is a water-thin adhesive that is great for producing strong acrylic bonds that are virtually invisible. You could also use superglue for this, but you have to be careful to not create white vapour marks on the black acrylic.
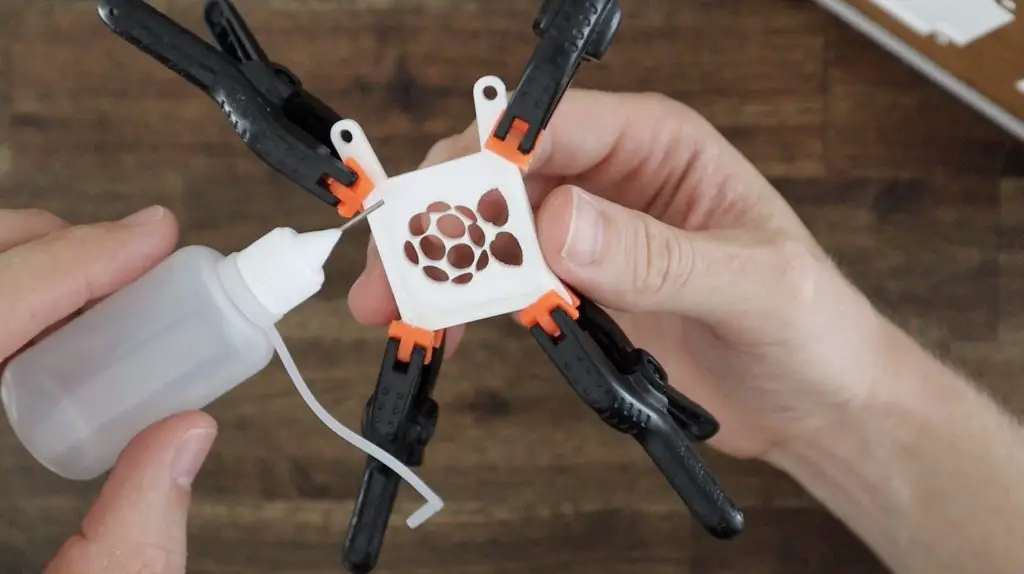
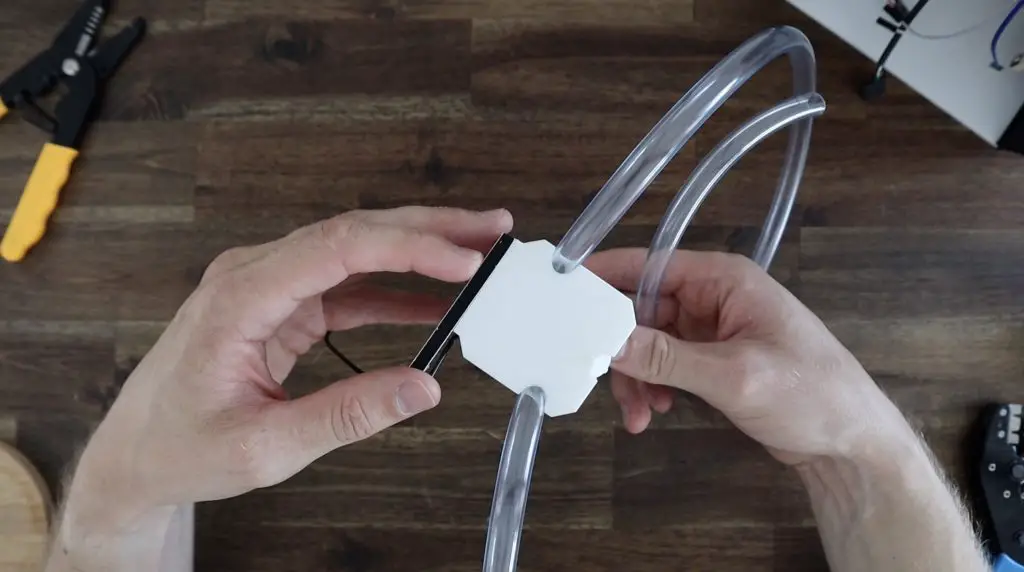
While I’ve got the weld-on 3 out, let’s also glue the retaining ring on the back of our water cooling bracket. This will hold the cooling block in the right place over the CM4 module.
With that, the acrylic part of the case is mostly complete, so we can move on to installing the hardware.
Installing The Computer Hardware Into The Case
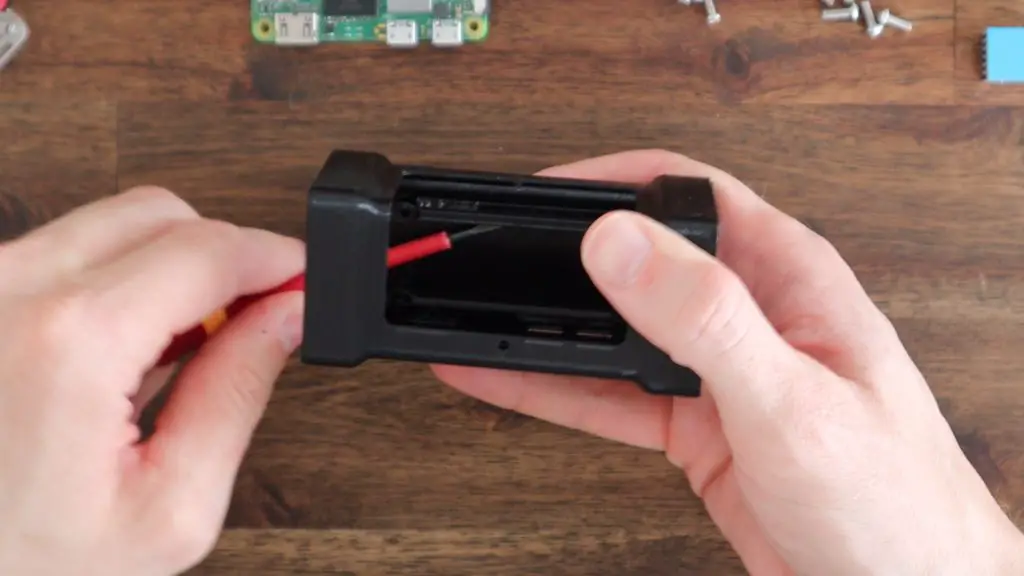
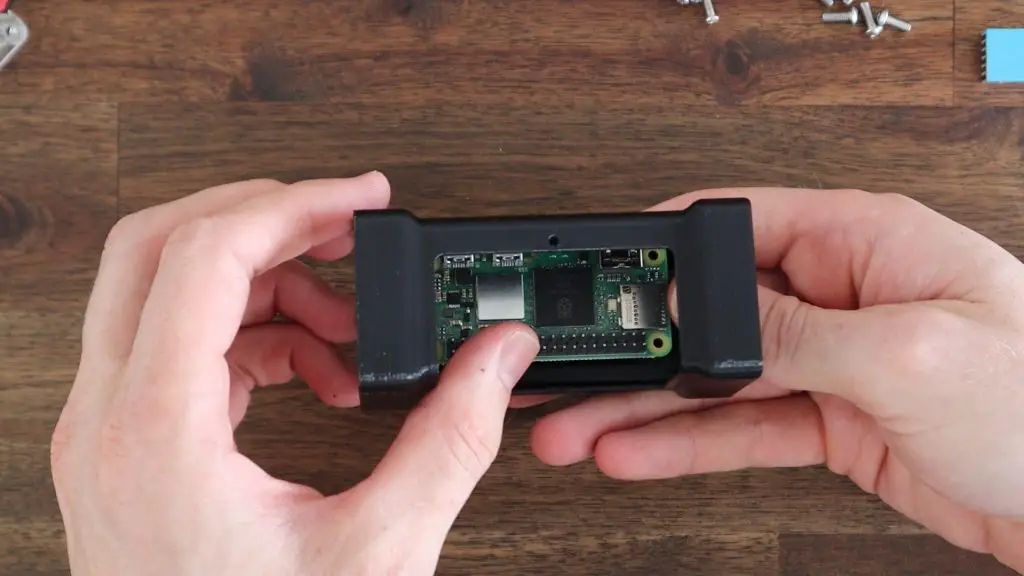
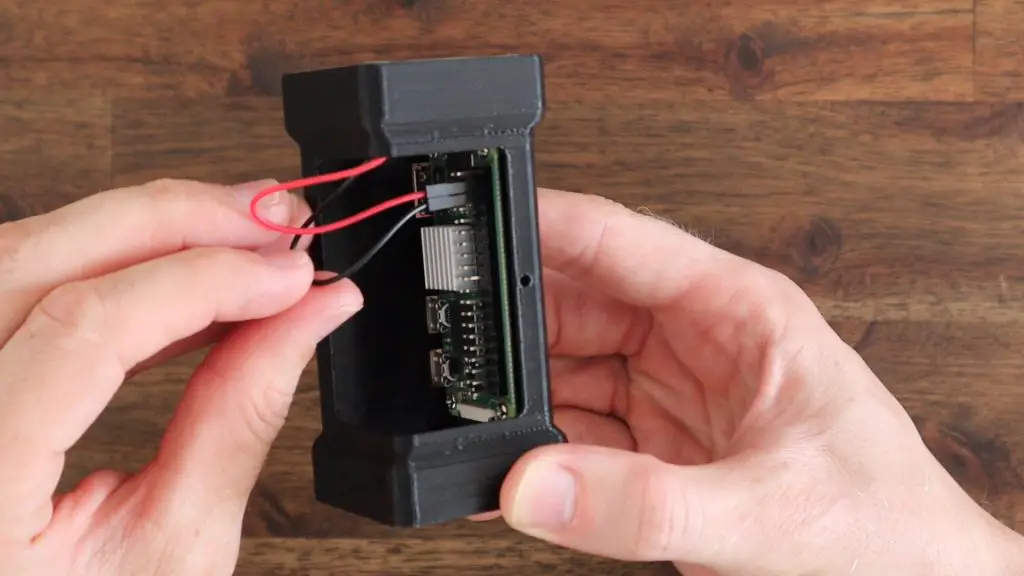
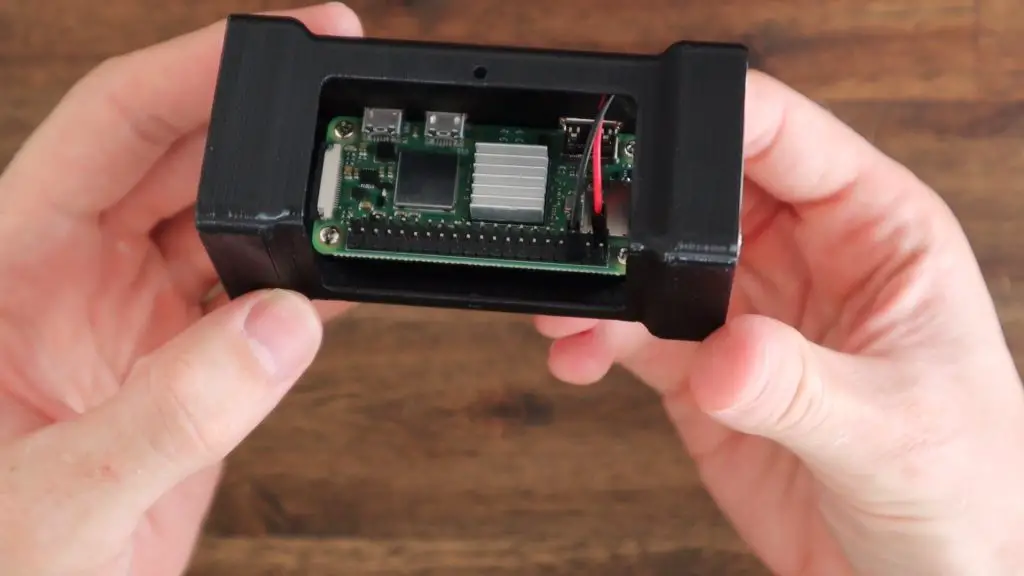
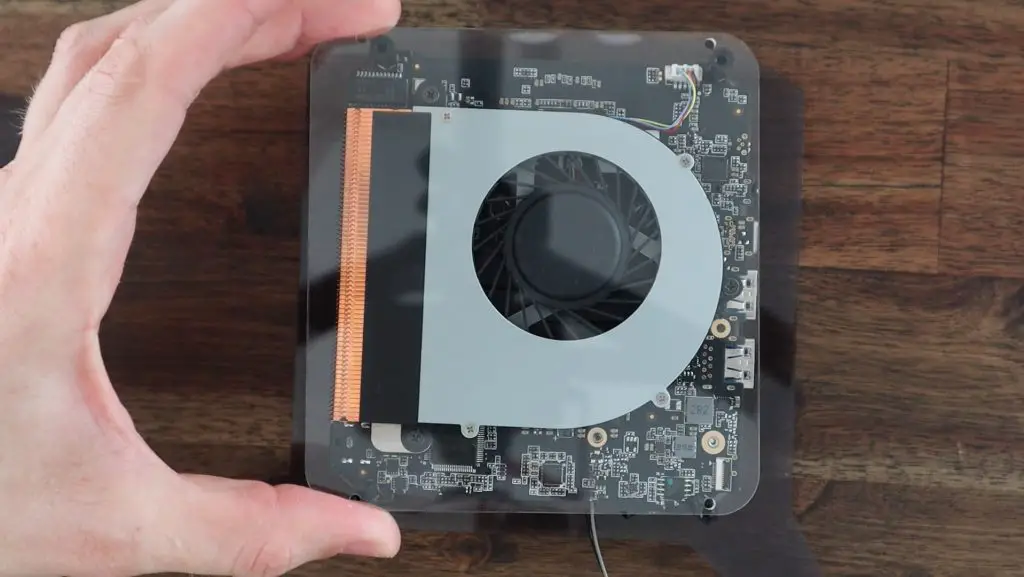
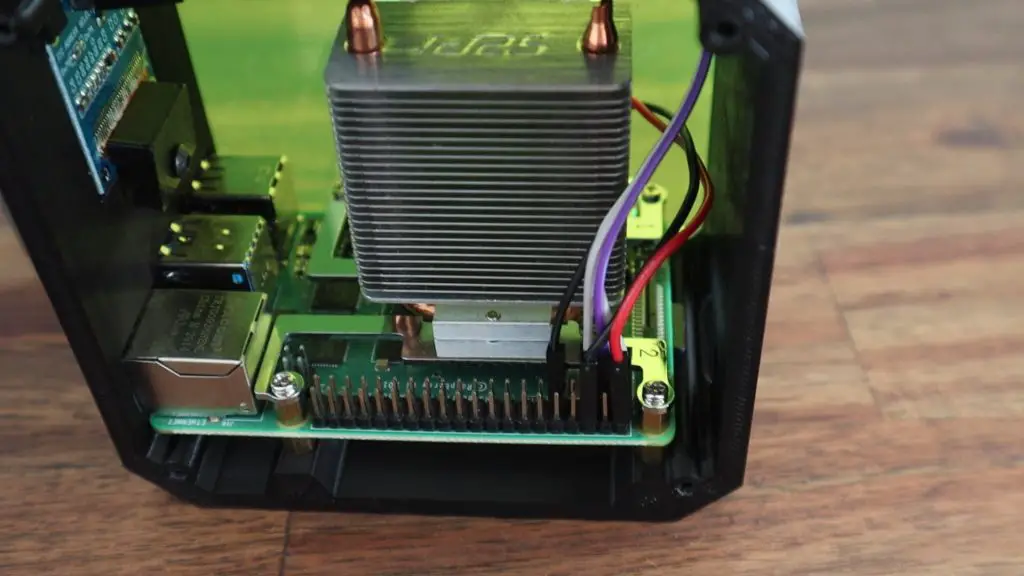
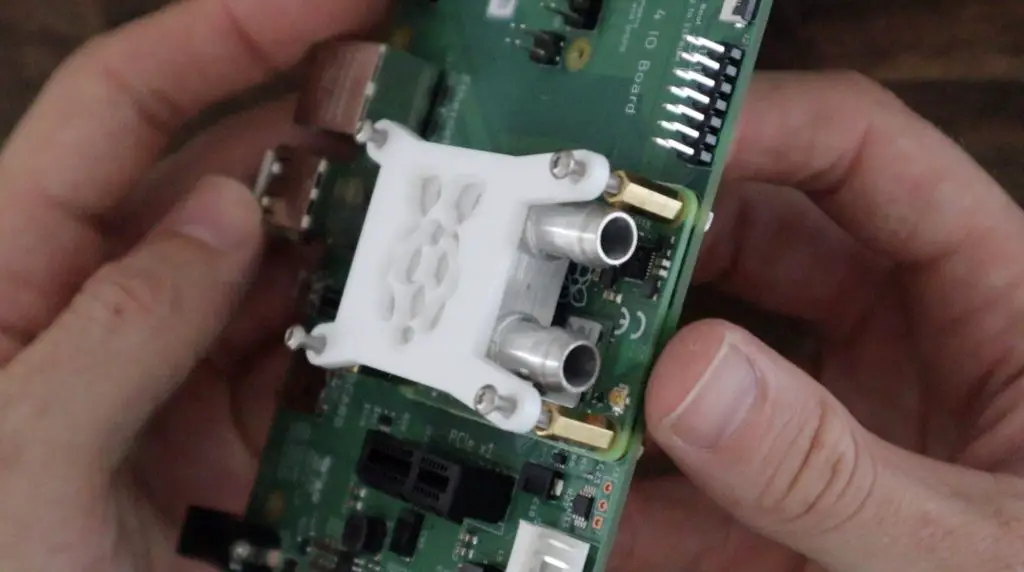
Let’s start off by putting our Raspberry Pi CM4 module onto our IO board and checking that the bracket that we’ve made lines up correctly.
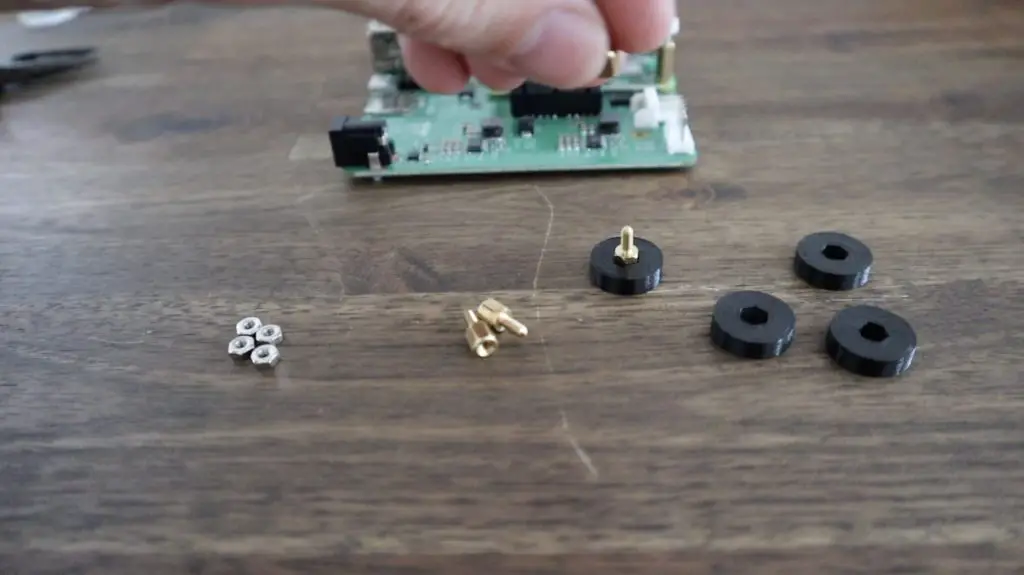
I’m going to be using some M2.5 brass standoffs, M2.5x12mm button head screws and M2.5 nuts to secure it. The nuts and standoffs will hold the CM4 module in place, although they’re mainly there to support the cooling block bracket. I’m not even going to tighten them as they’ll then bend the CM4 module and I might break some of the surface components.
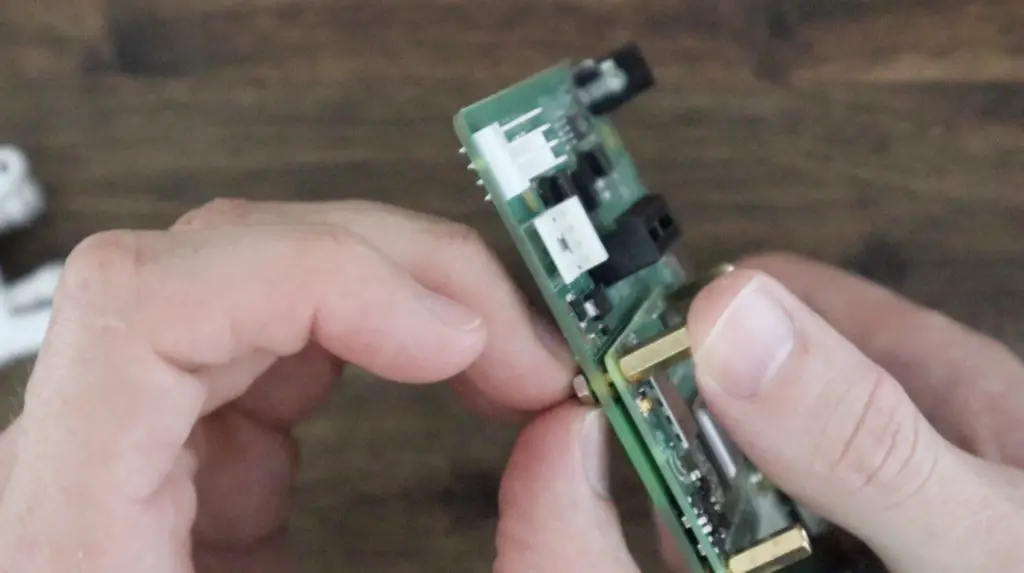
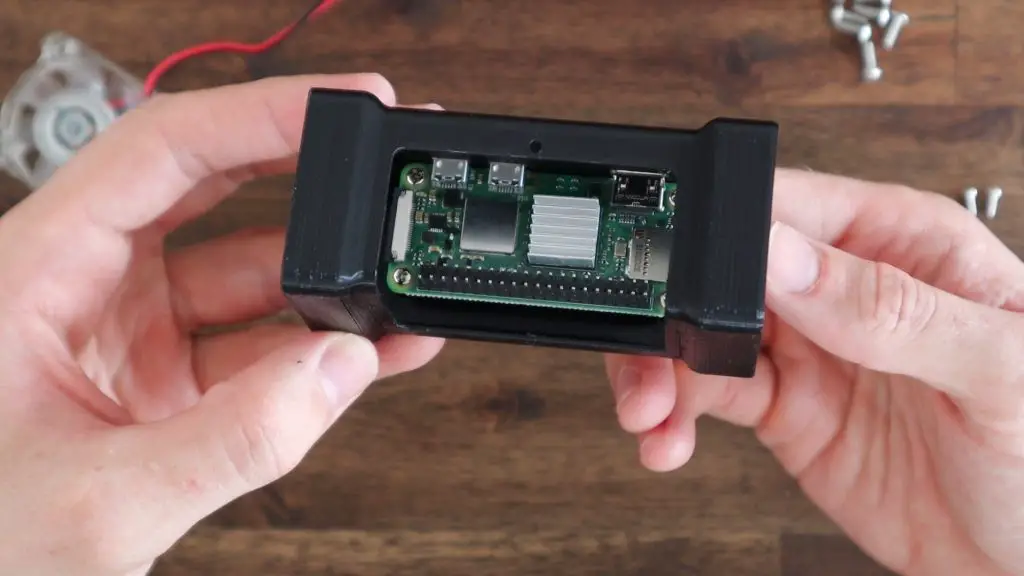
I’m going to add a small thermal pad between the cooling block and the CM4 module to assist with heat transfer between the two components.
With the bracket installed, it looks like it fits quite well and we should have enough room to get out tubes past the standoffs on the inlet and outlet.
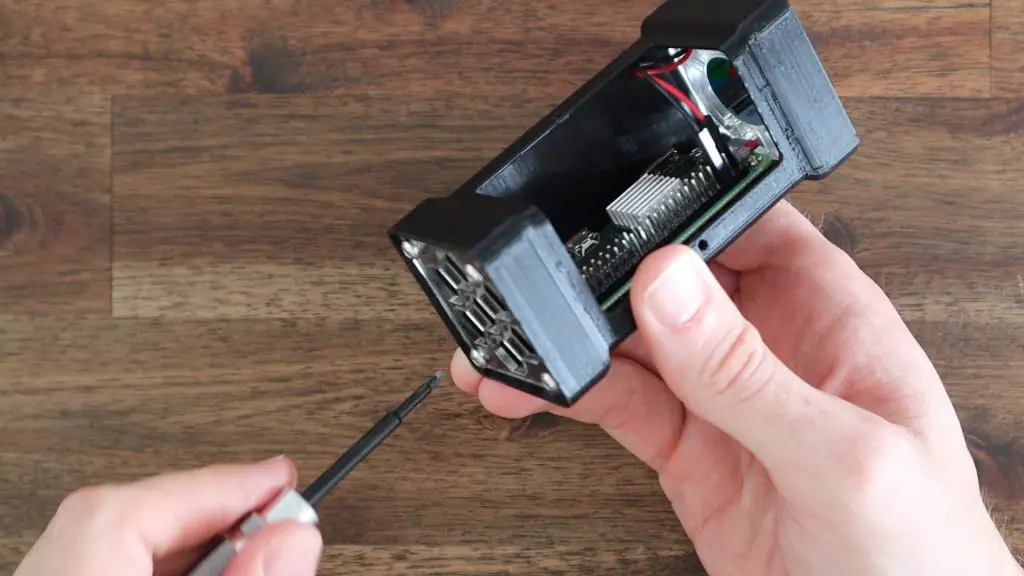
Mounting The Raspberry Pi IO Board In The Case
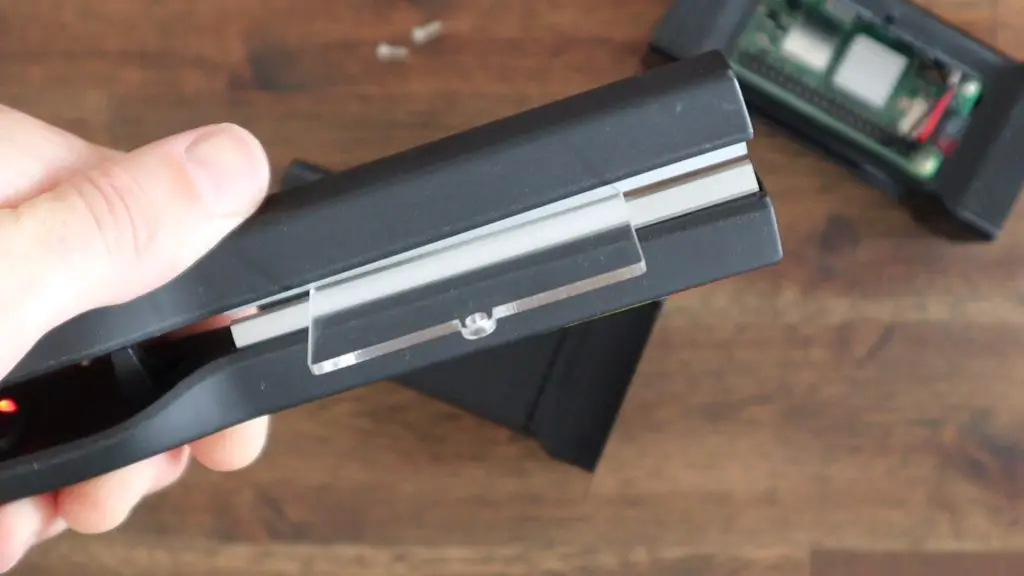
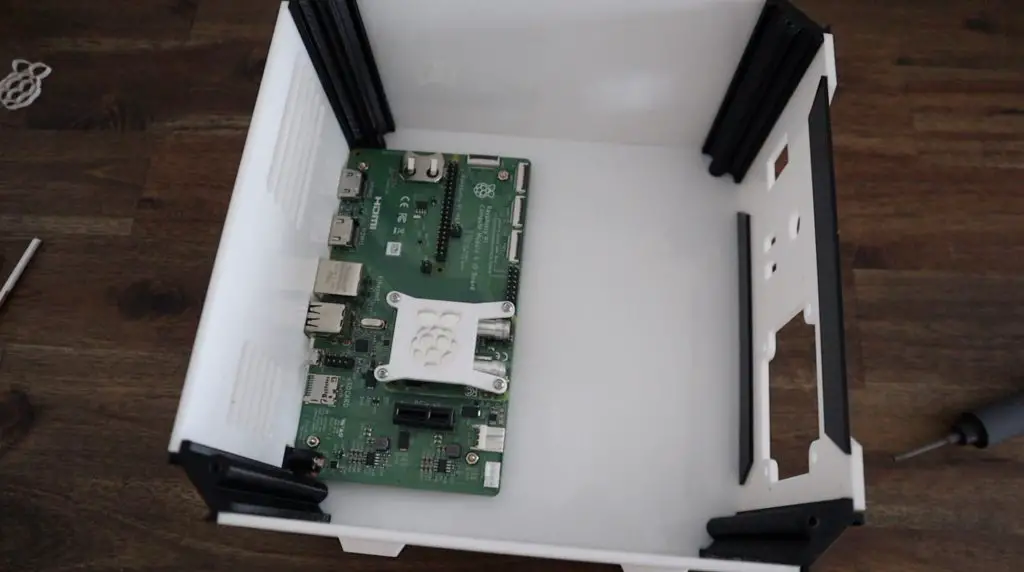
Now let’s mount our completed Raspberry Pi IO board in the case. Rather than drill holes through the side of the case and then have nuts stick out the outside, I’ve 3D printed some supports to each hold an M2.5x4mm brass standoff. I’ll glue these onto the white side panel and these will then hold the board in place.
We just need to trial fit the board to get the position of each standoff and we can then glue them into place. I did this a couple of times to be sure before actually gluing them down, but it seems to have worked well.
Mounting The Front Panel Components
Next, let’s move on to mounting all of the components required on the front panel.
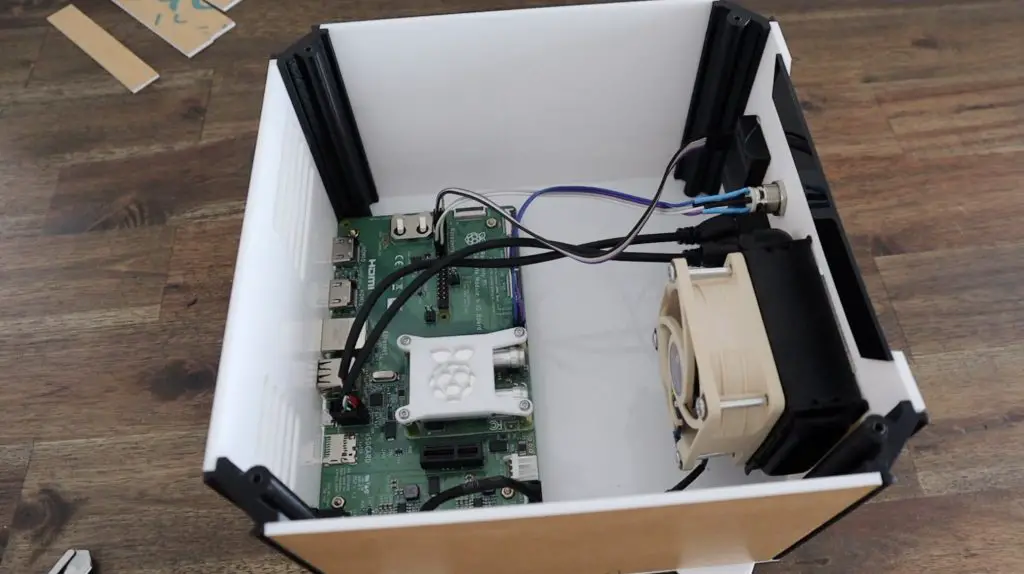
First, I’m going to mount the fan to the radiator and I’ll then mount the complete assembly onto the front panel. This way I don’t have to try to fit a screwdriver within the case.
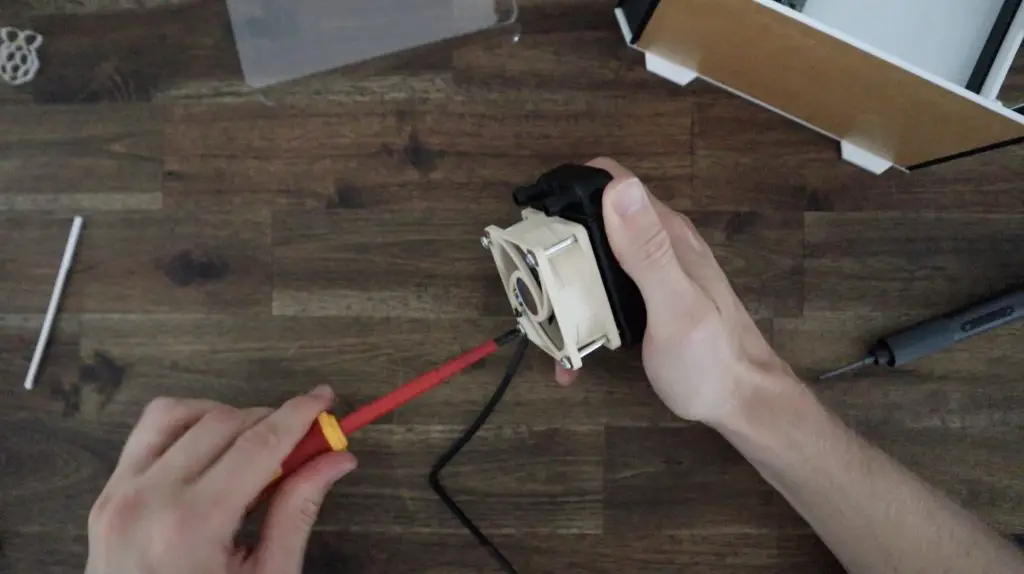
The holes on my radiator don’t align very well with the holes on the case, but I was able to get them in eventually. For some reason, the radiator seems to be a little narrower than it should be, so the holes aren’t quite square.
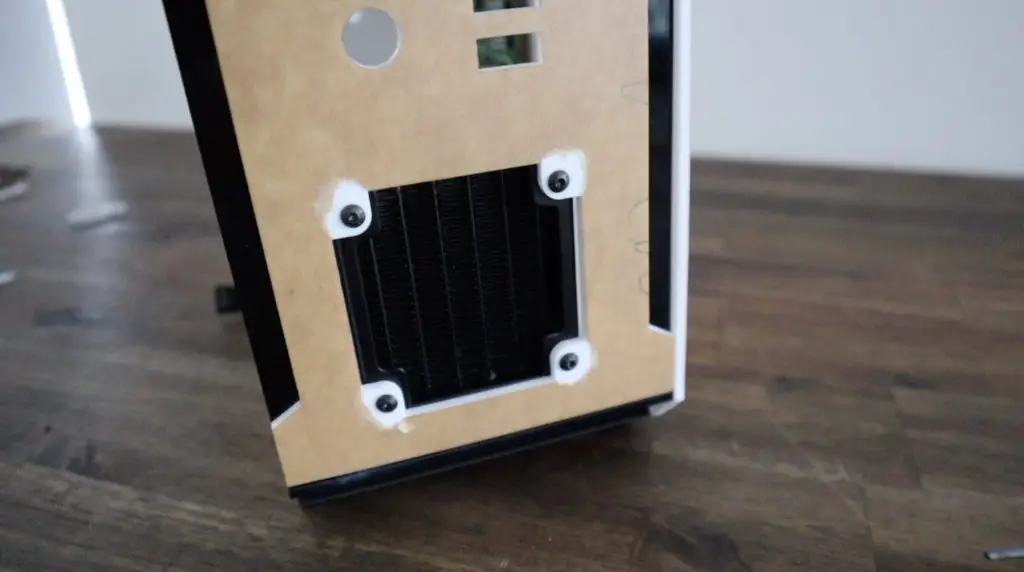
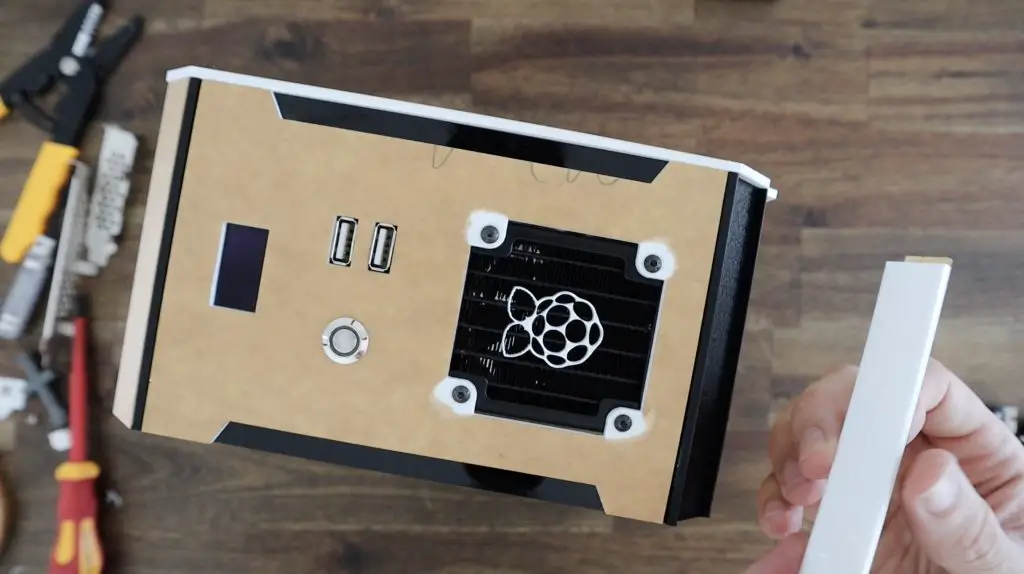
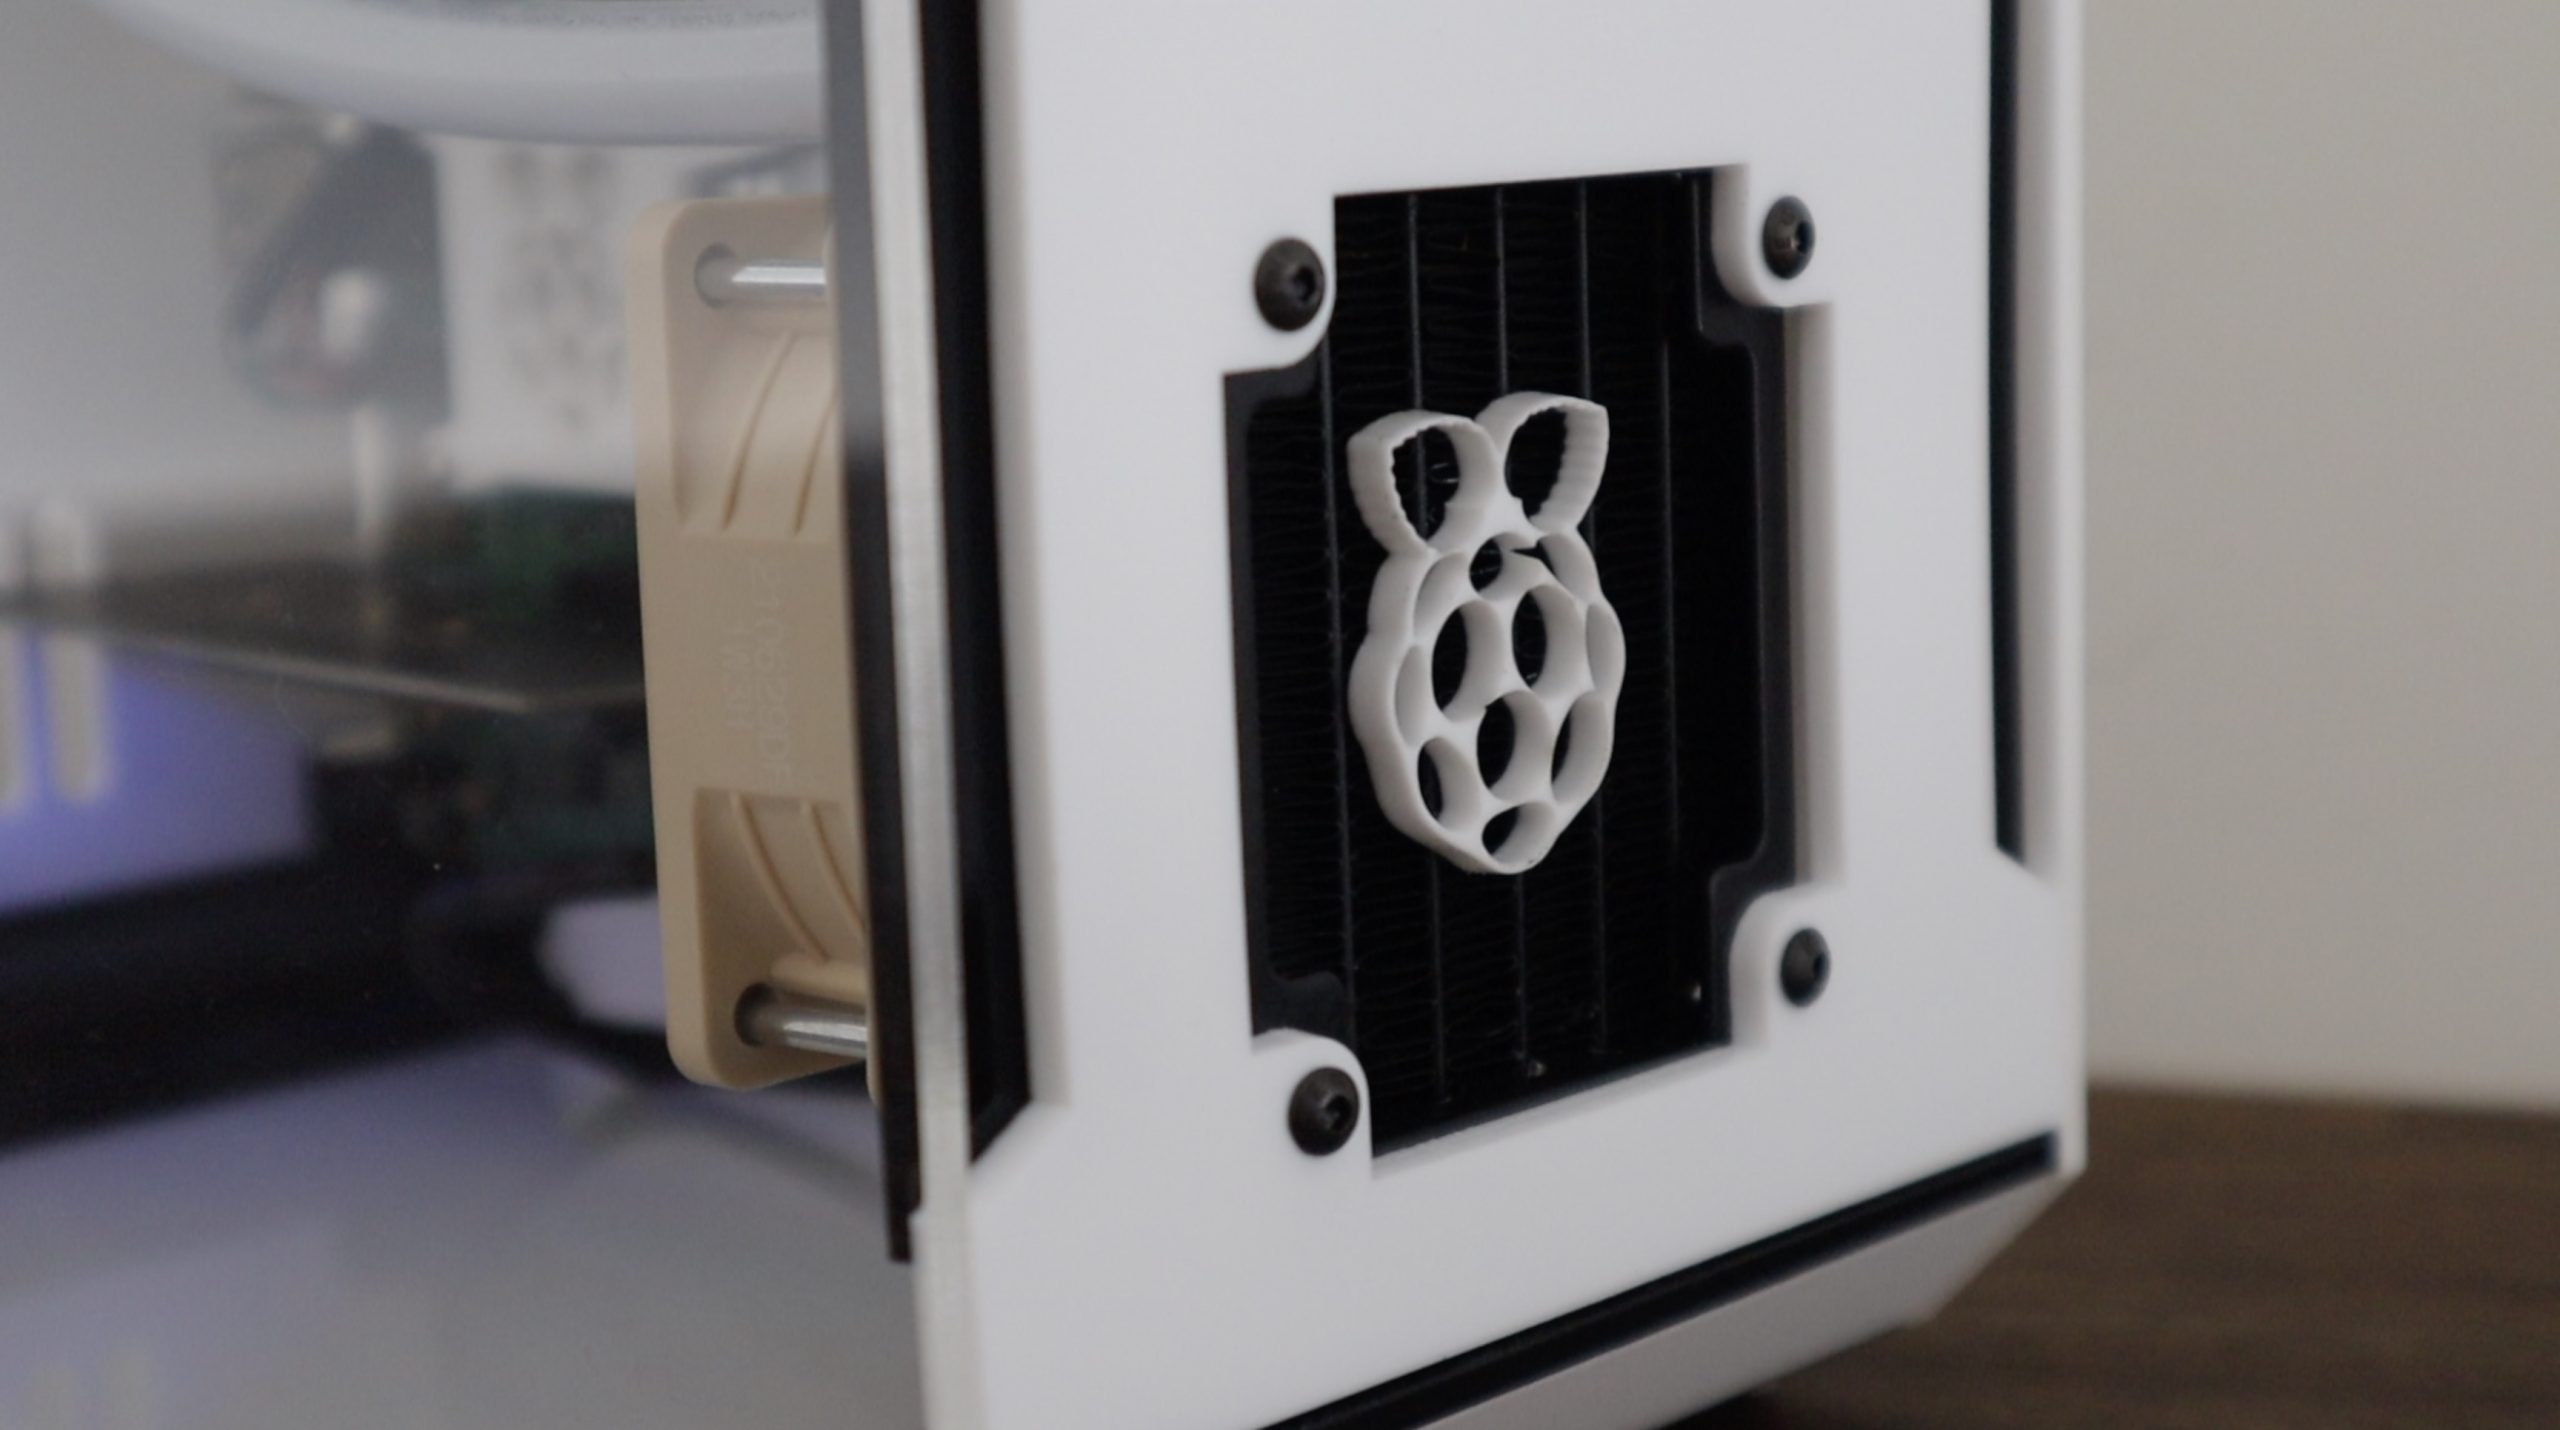
The black radiator against the white front panel is starting to look quite good, now we’ve just got one final touch to add – our Raspberry Pi logo which I glued into place using some superglue.
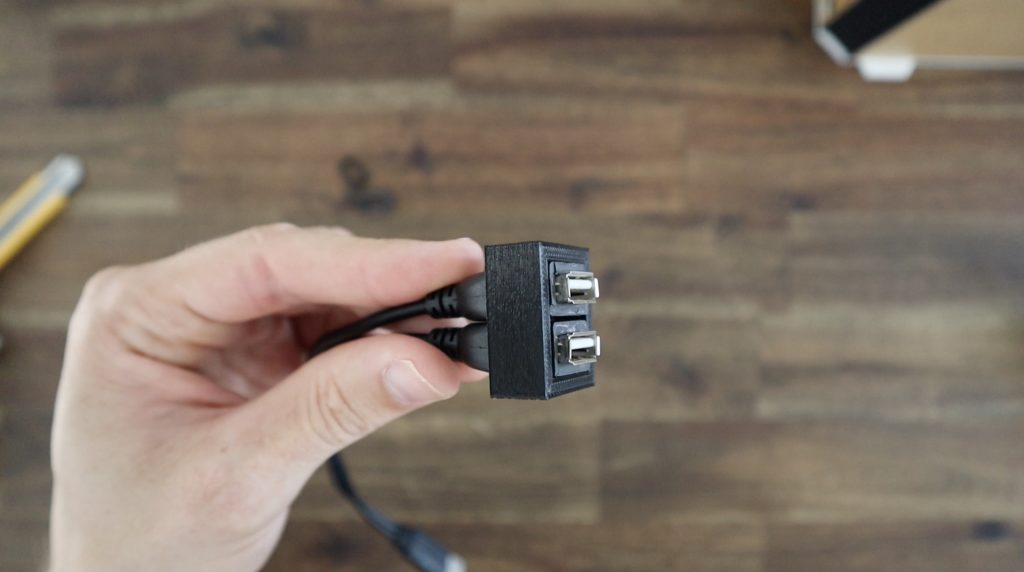
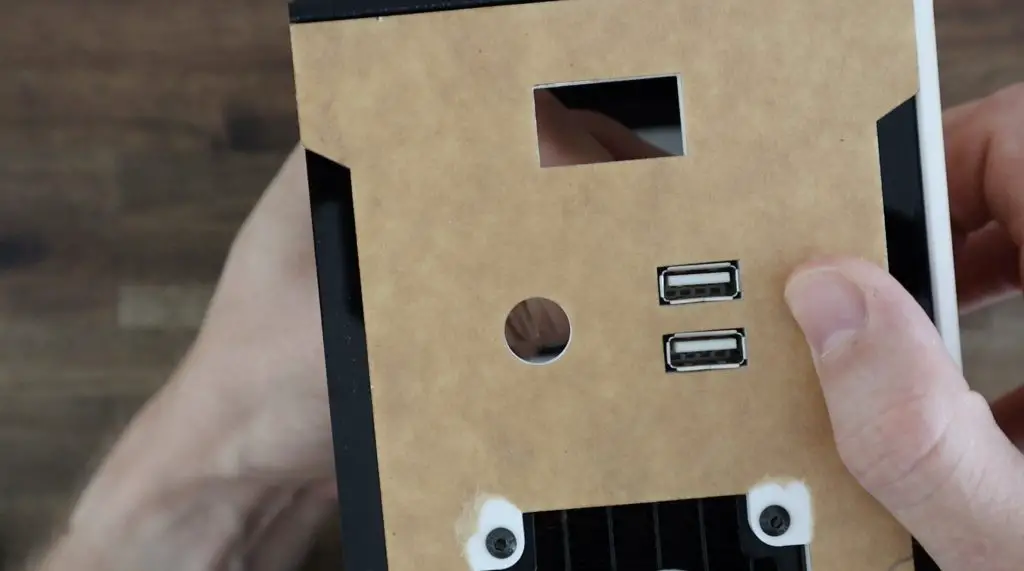
I 3D printed a rectangular housing to hold the two USB ports together. We need to trim a little bit of the plastic off around each port so that the port sits flush with the front of the acrylic rather than behind the acrylic. We can do that with a craft knife.
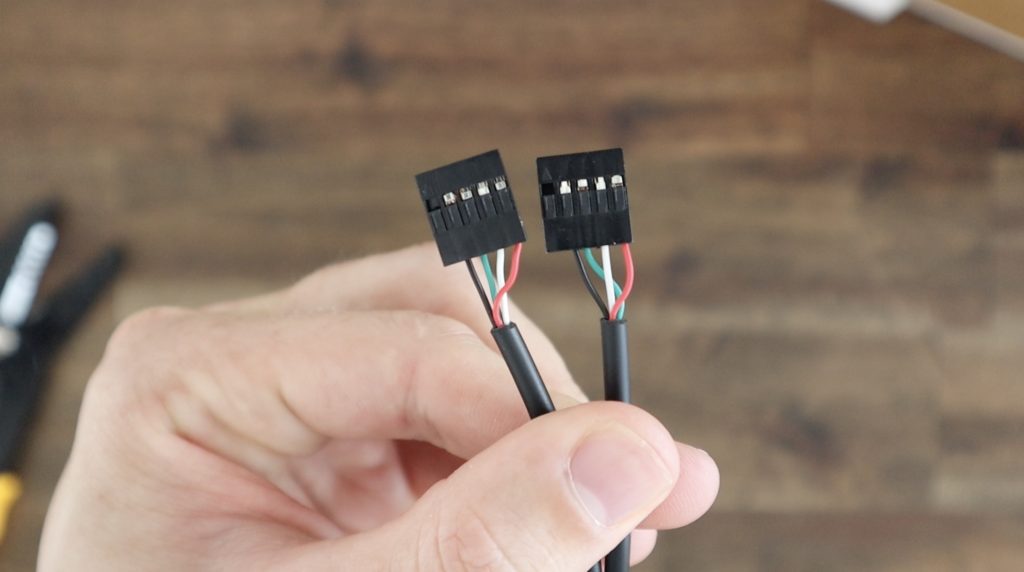
We then also need to cut the other end off of the cables and add some female header pins to them. There are only four pins on each, two for power and two for data, but I’m going to use a 5 pin cover to match the 5 pin arrangement on the IO board so that I know which way around to plug them in. You might find that one of the leads on your splitter only has two wires for power. If this is the case then you’ll need to use a port from a second splitter as well because you need to have all four wires in order to transfer data.
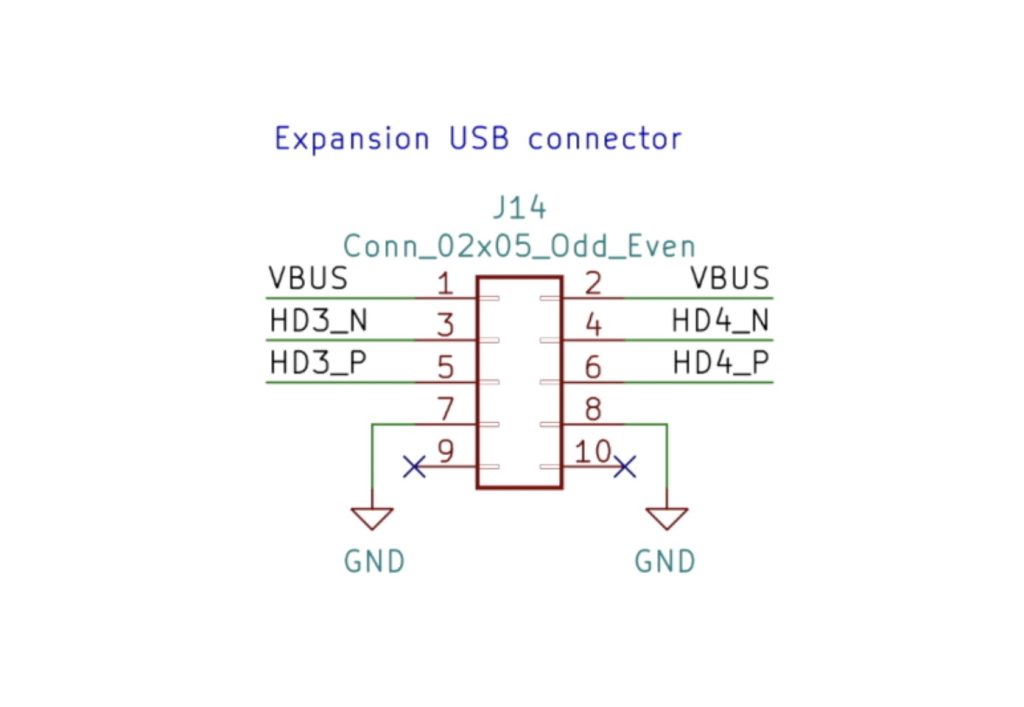
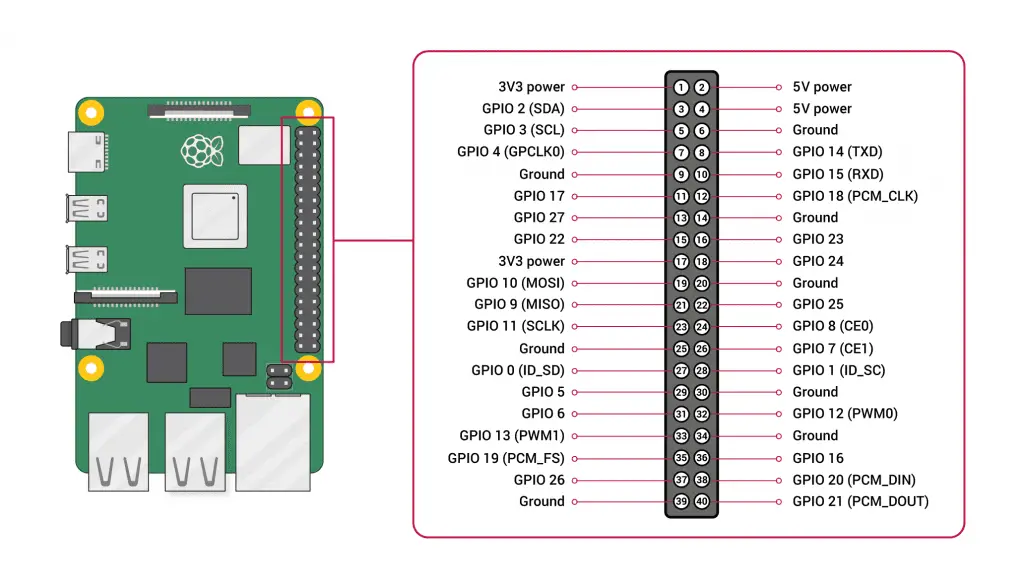
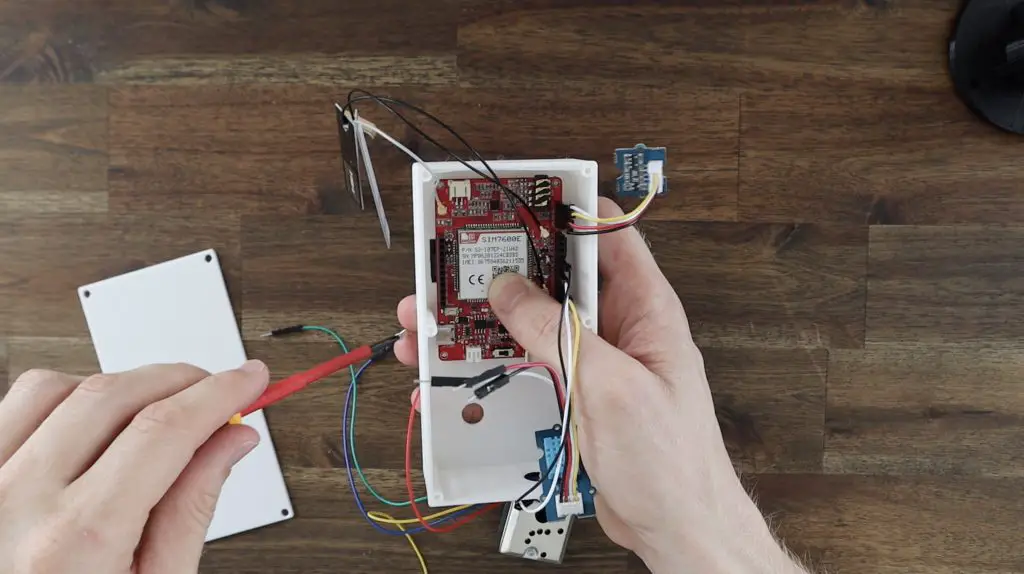
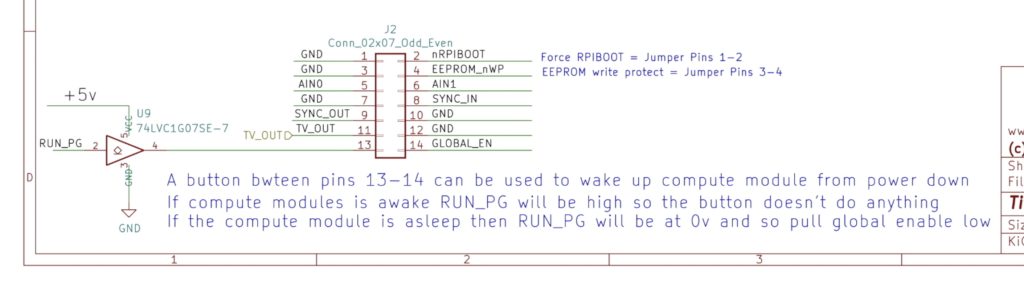
The pins are crimped onto the stripped ends of each wire using a Dupont crimper and the plastic cover or holder then slips onto each pin to hold it in place. You’ll notice the wiring arrangement matches the above pin layout from the IO board’s schematics.
Now that we’ve got the pins on, let’s glue the USB ports into place.
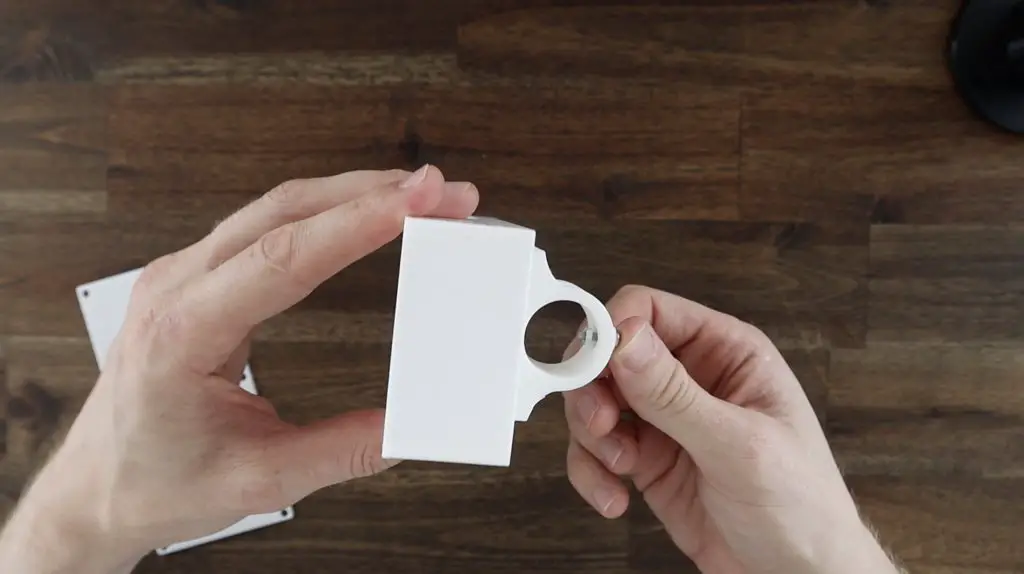
I’ve gone ahead and added some leads and female pins to the power button, which is just held in place with a nut on the inside. The power button has four wires, two for the LED ring light which I can just plug into any 3.3V and GND GPIO pins and two for the switch contacts. You’ll need to also solder a 220-750 ohm current-limiting resistor onto one of the LED legs to protect it. The higher the resistance, the dimmer the LED will be, so choose this to suit your preference.
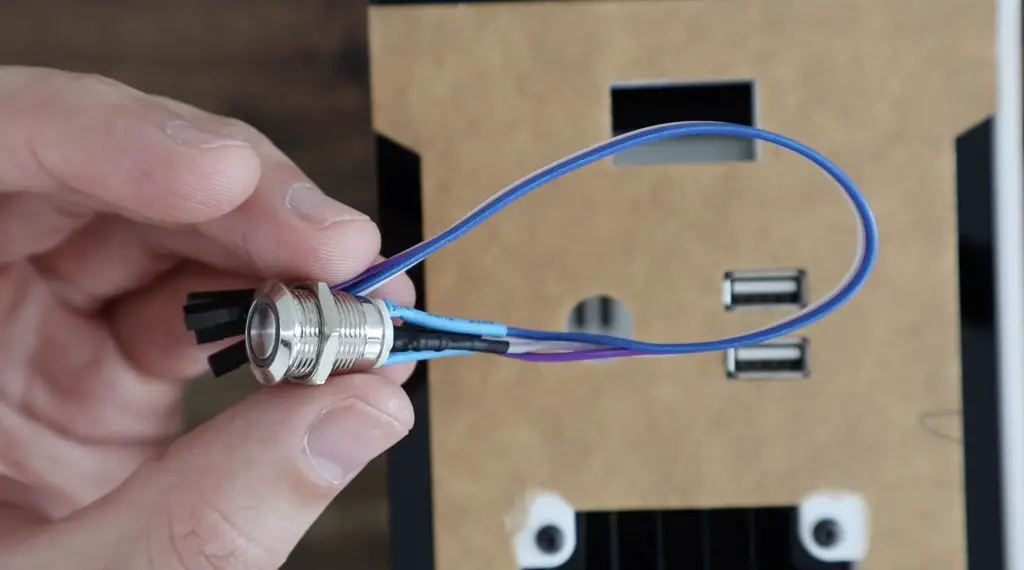
I’m going to connect the power button’s contacts to pins 13 and 14 on header J2 as outlined in the documentation. This probably means that the button won’t work to shut down the Raspberry Pi, it’ll only wake it up once it is off, but I can live with that.
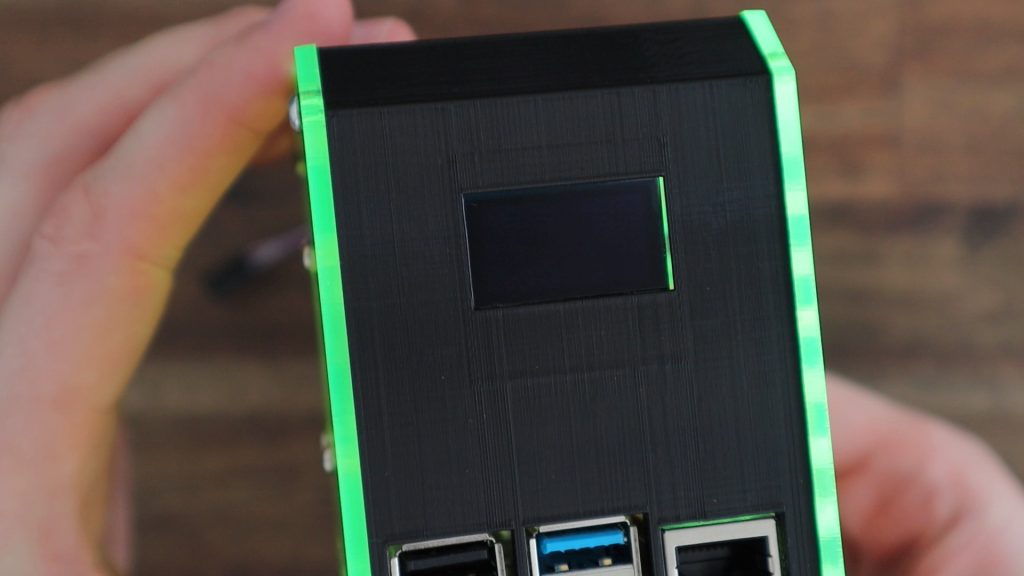
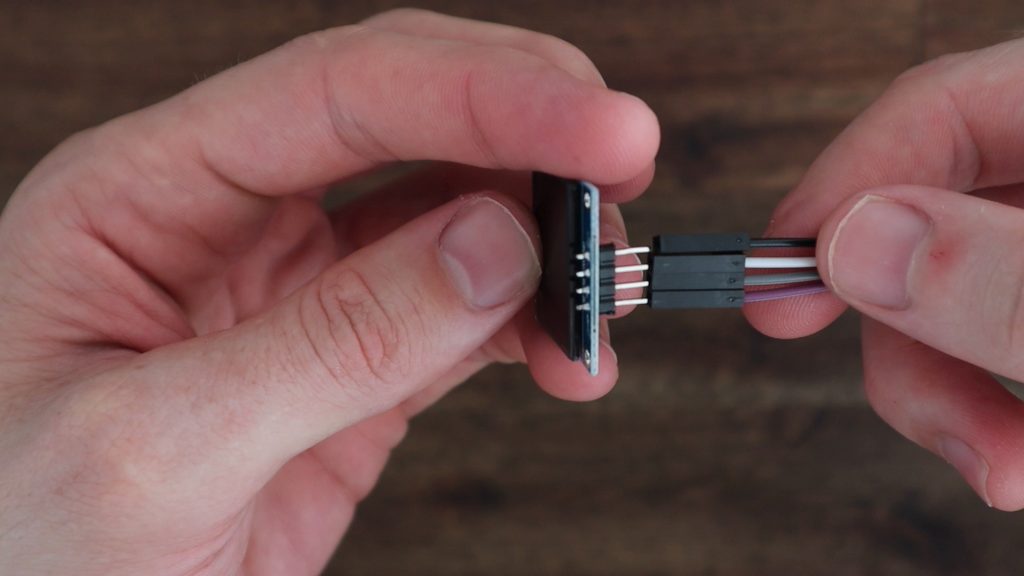
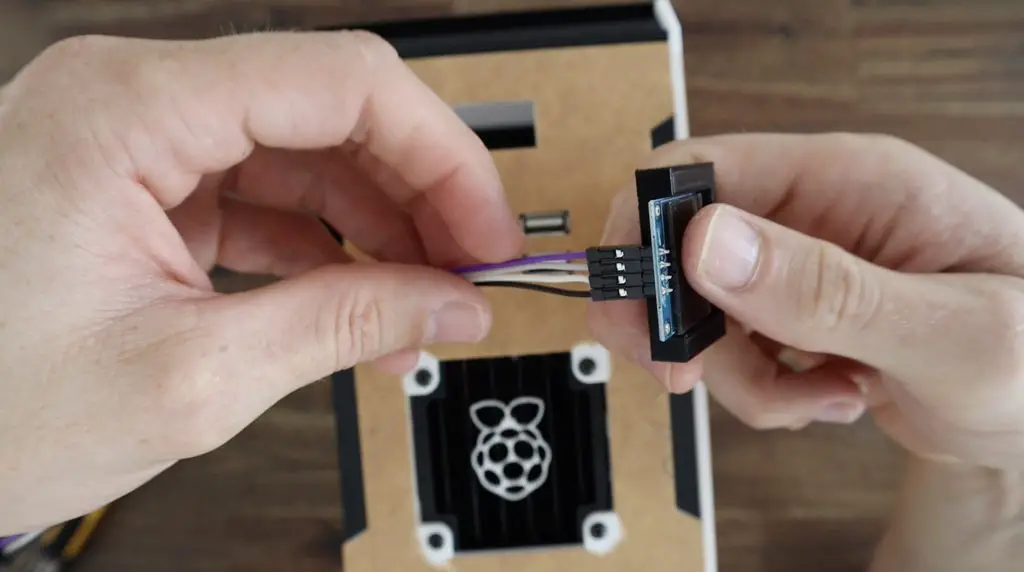
I’ve also 3D printed a holder for the display which we can also glue into place. The display just used some 20cm breadboard jumpers to plug into the power and I2C GPIO pins.
Making The Reservoir & Completing The Water Cooling Loop
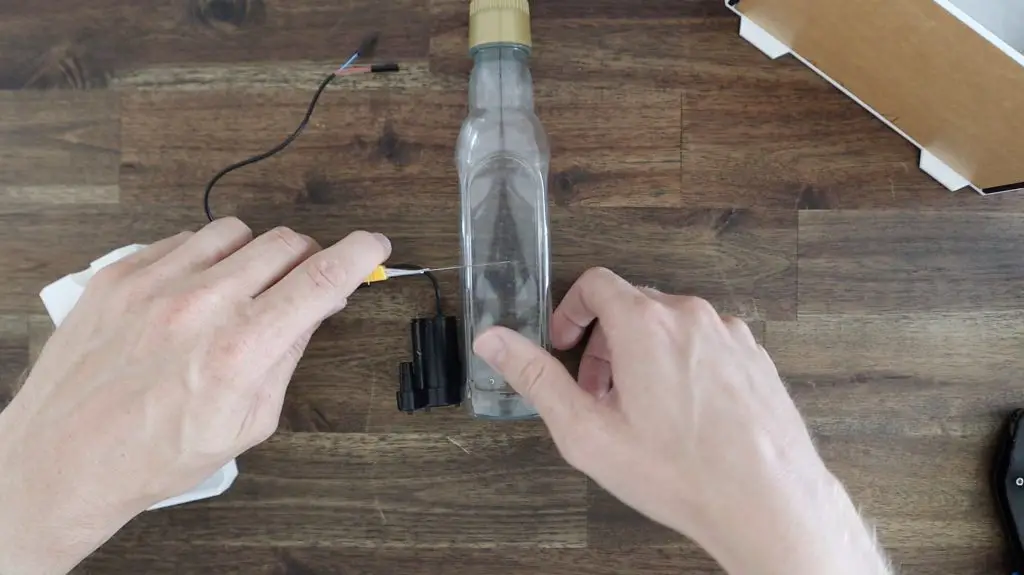
I couldn’t find a reservoir that is small enough for this size case, so I’m going to make a custom one up using a small clear container. This is easier than trying to glue acrylic pieces together with the hope that it will eventually be watertight.
It just needs to be tall enough to hold the pump, so we can trim down the bottle quite a bit.
I’ve designed and 3D printed some caps to go onto each end which will also be used to mount the reservoir onto the side of the case.
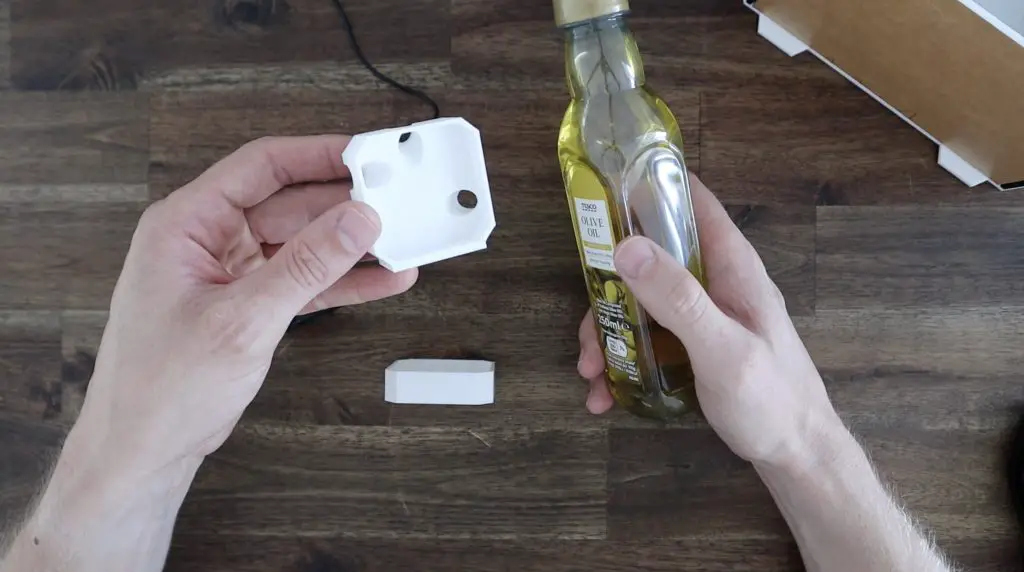
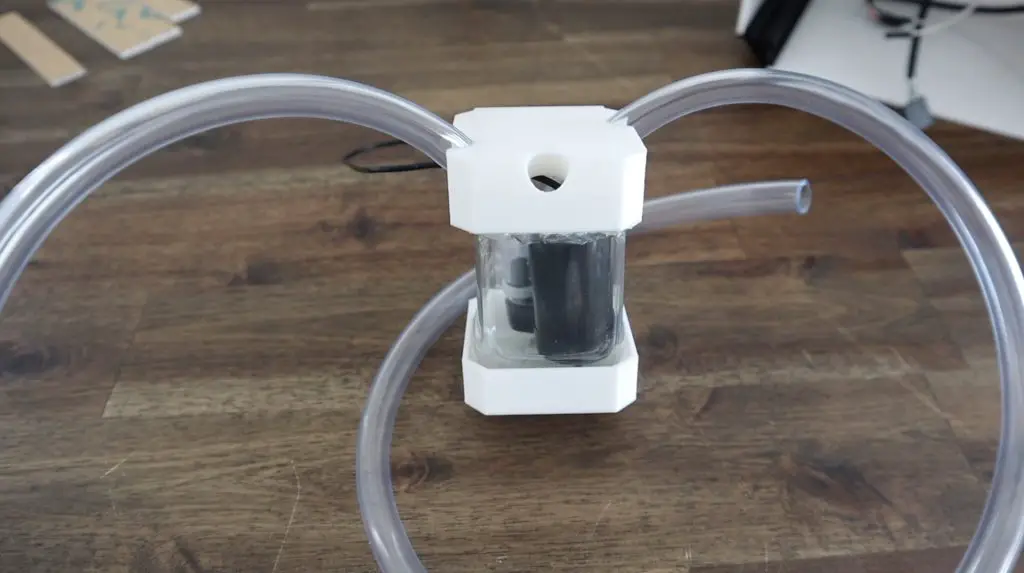
We can then push one end of the tube onto the pump, put the pump into the reservoir and then install the two end caps using some hot glue. The hot glue seals up the edges a little so that if the case is bumped, the coolant doesn’t spill out of the reservoir.
I’m going to use a section of foam strip to stick the reservoir to the side panel to dampen any vibrations from the pump which will hopefully result in a quieter running system.
I’ve installed the reservoir near the top of the case so that there is less risk of it overflowing and it’ll make it easier to top up.
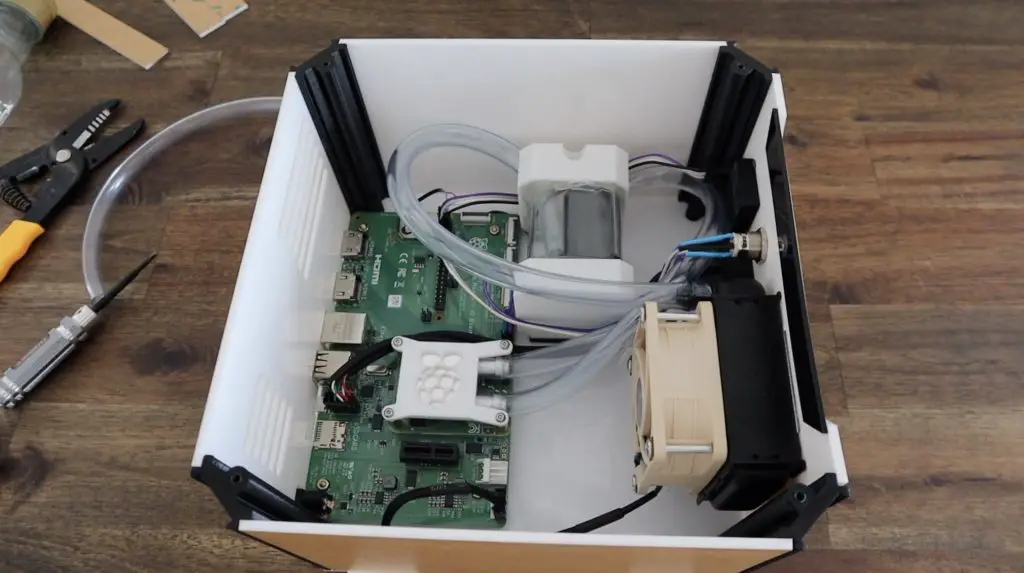
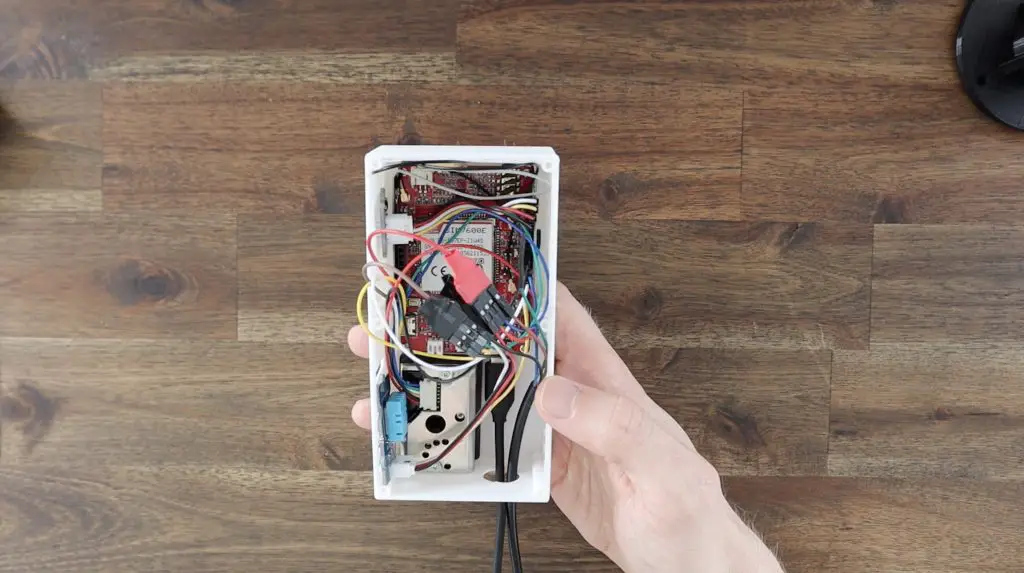
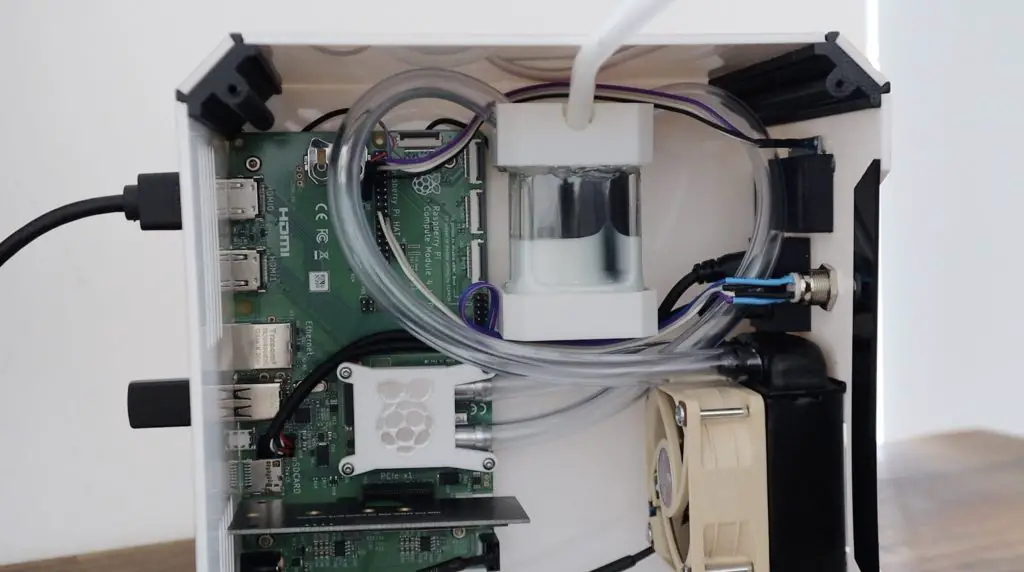
I’ve run the flexible tubing on the shortest paths between the components. The cooling block should probably rather have had the upper port as the outlet on the return back to the tank so that air is less likely to be trapped in the void, but this complicates the tubing run to the radiator, so I’ve run it like this.
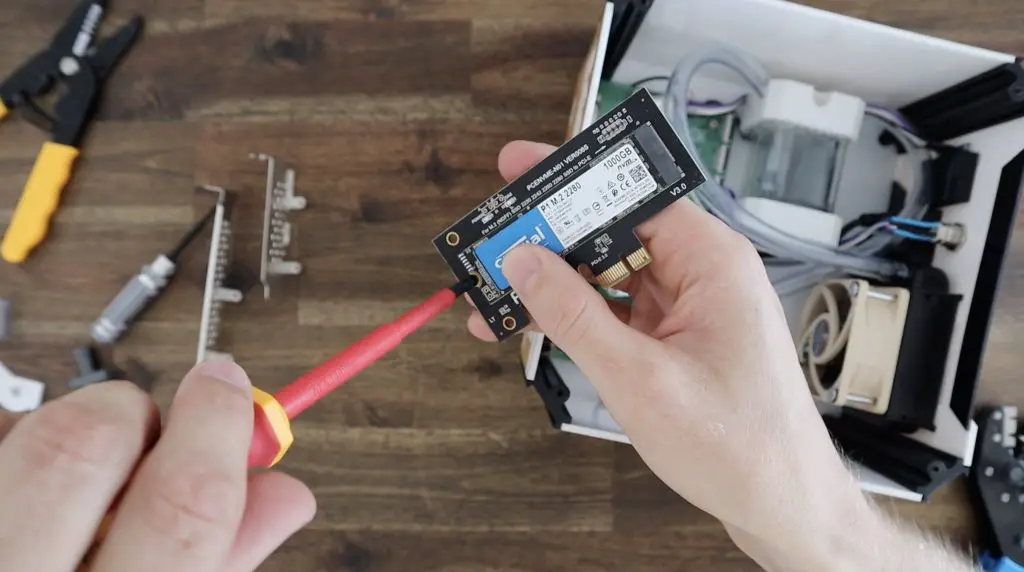
Installing The NVME Drive
Next, we can move on to installing our NVME drive. We need to remove the metal bracket that is supplied with the adaptor. They give you a shorter one as well but we don’t need these on this build as it’s not a standard case size.
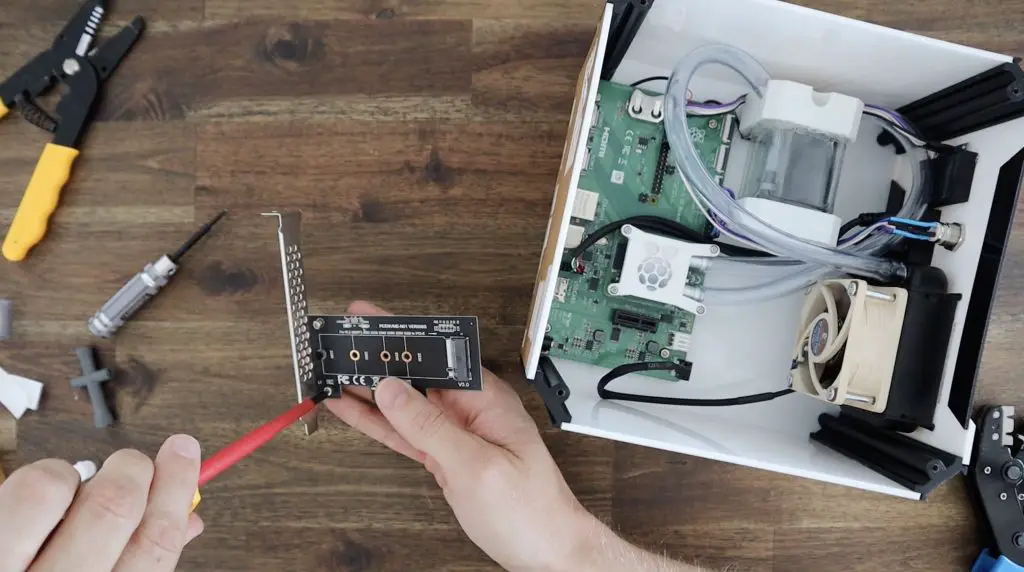
We can then plug our SSD into the adaptor, add the small screw to secure the drive and plug the adaptor into our PCIe slot.
Finishing Off The Ultimate Raspberry Pi Desktop Computer Build
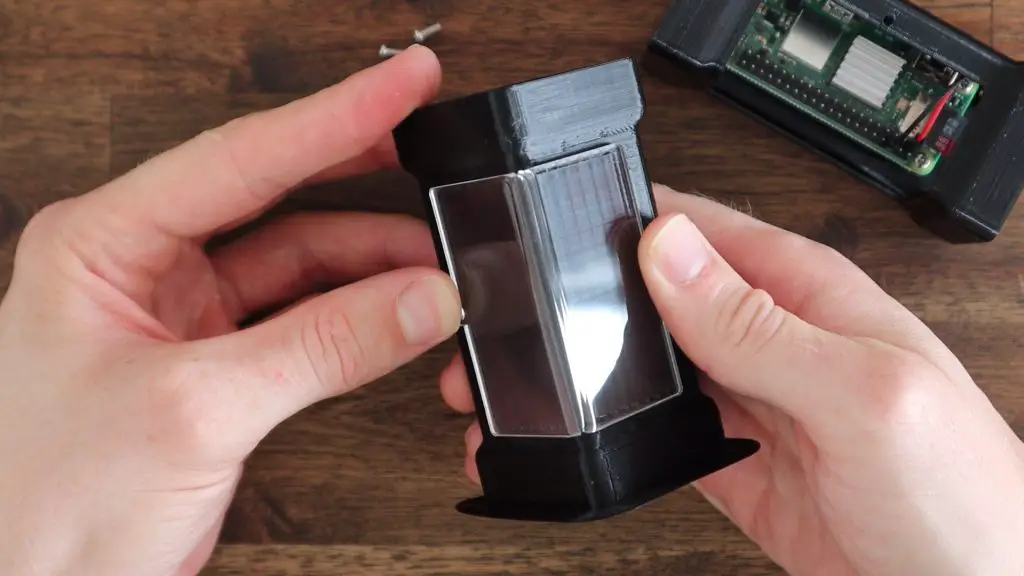
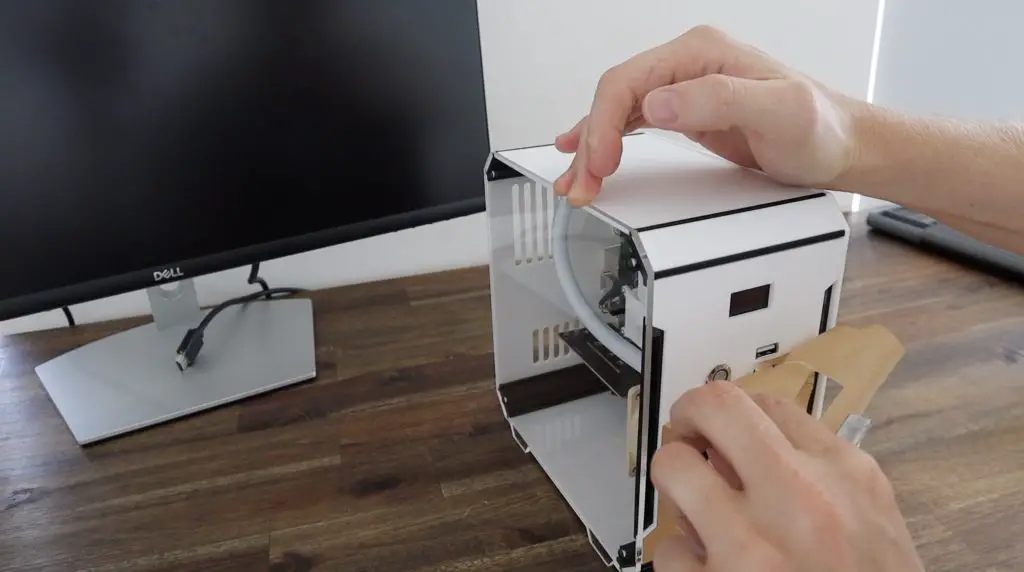
To finish off the case, we just need to glue on the acrylic accent pieces. These fit into the holder on the 3D printed corner pieces and I’ll glue them in place with some superglue.
We can then fill up the reservoir, then close it up with a 3D printed plug and screw on the clear side panel. I’m going to use opaque white coolant in the system to match the white acrylic. It would also be good to eventually get some white sleeving for the cables to neaten them up a bit in the future as well.
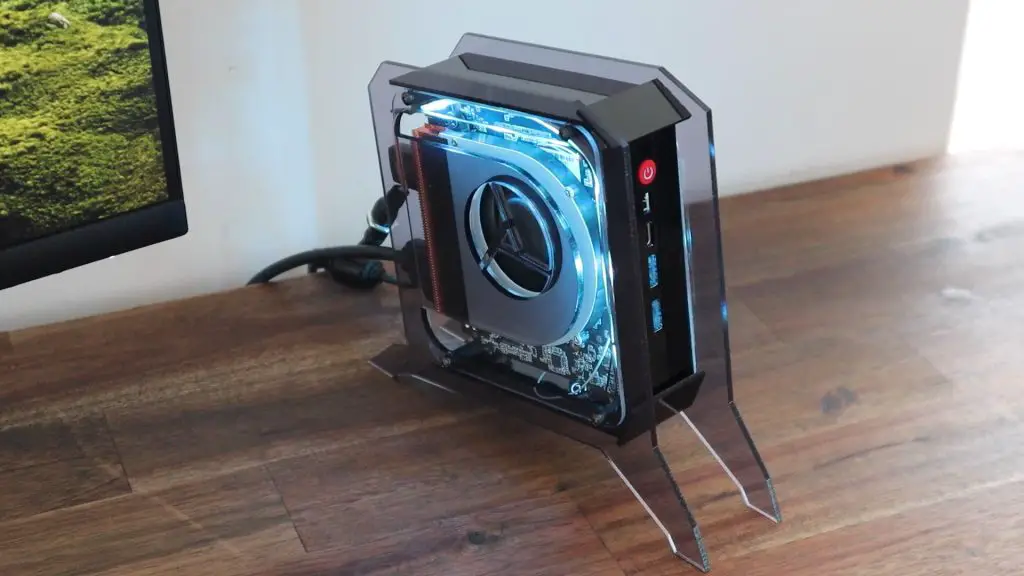
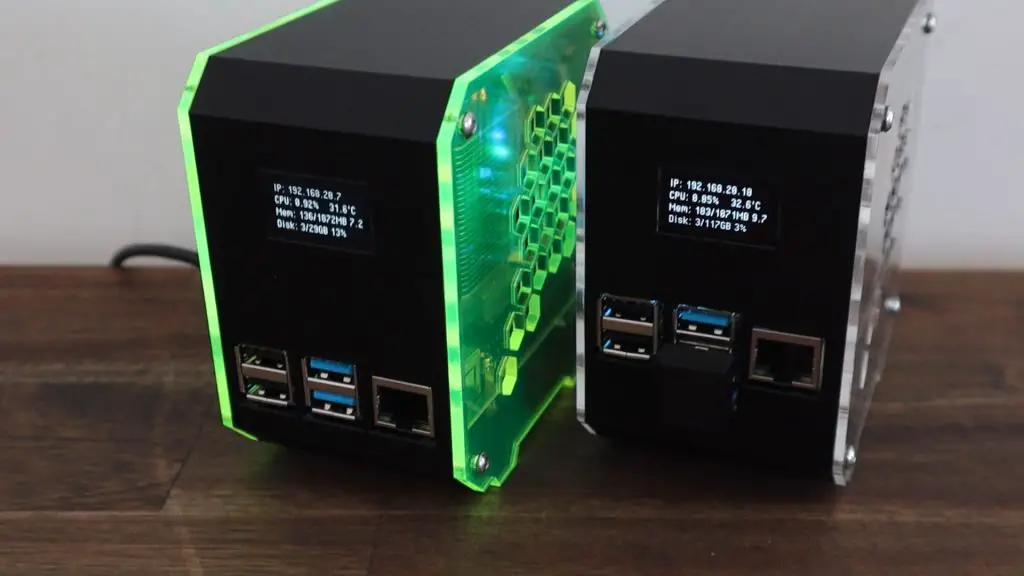
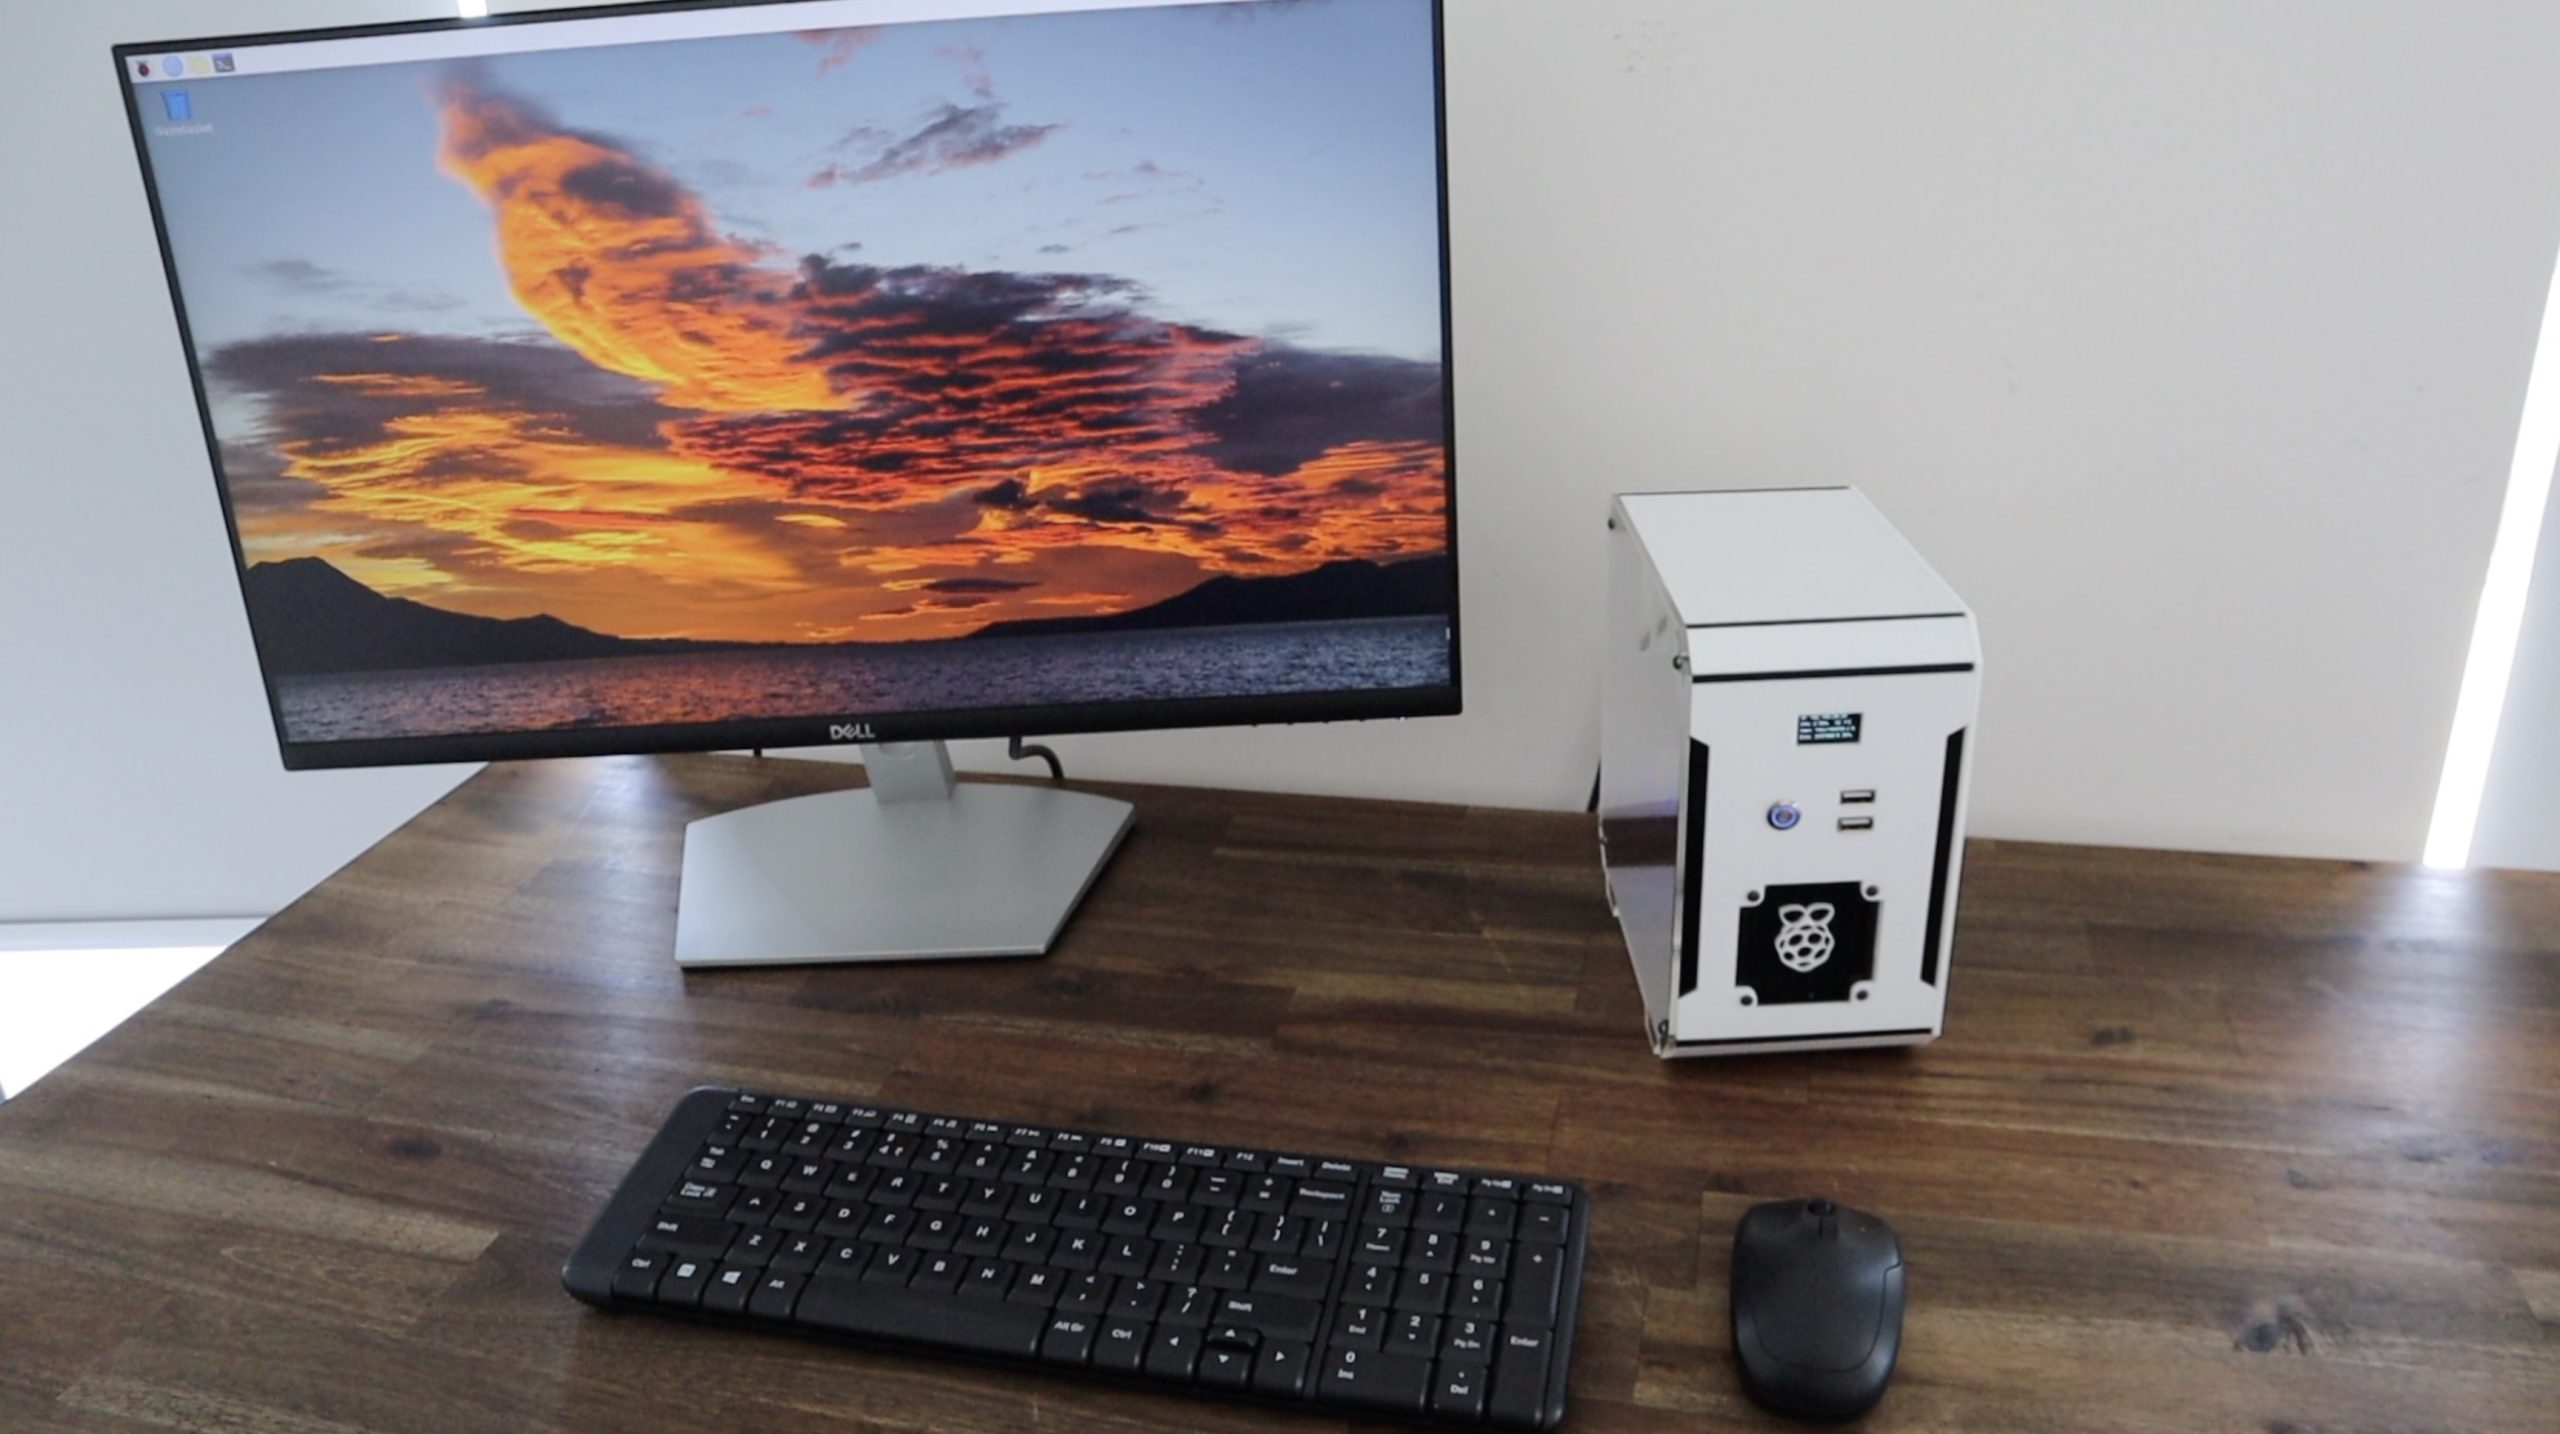
Let’s peel off all of the remaining protective film and see what it looks like.

Final Thoughts
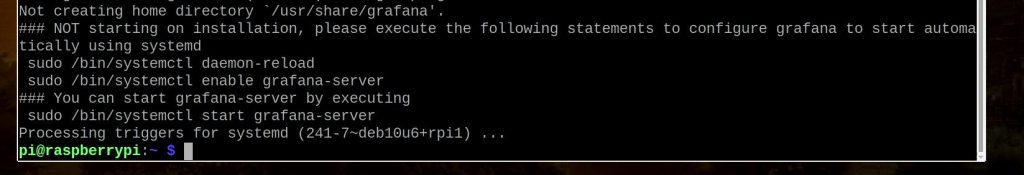
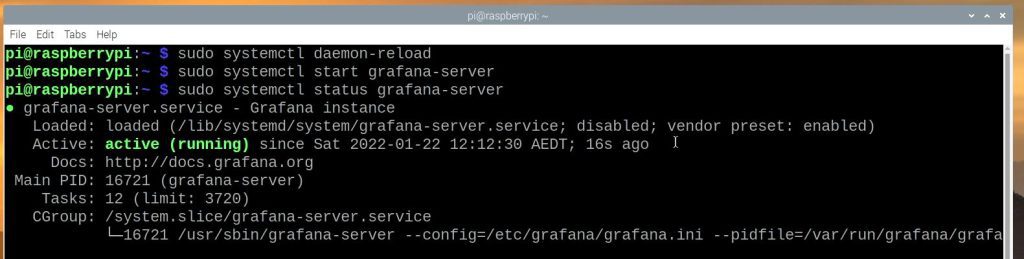
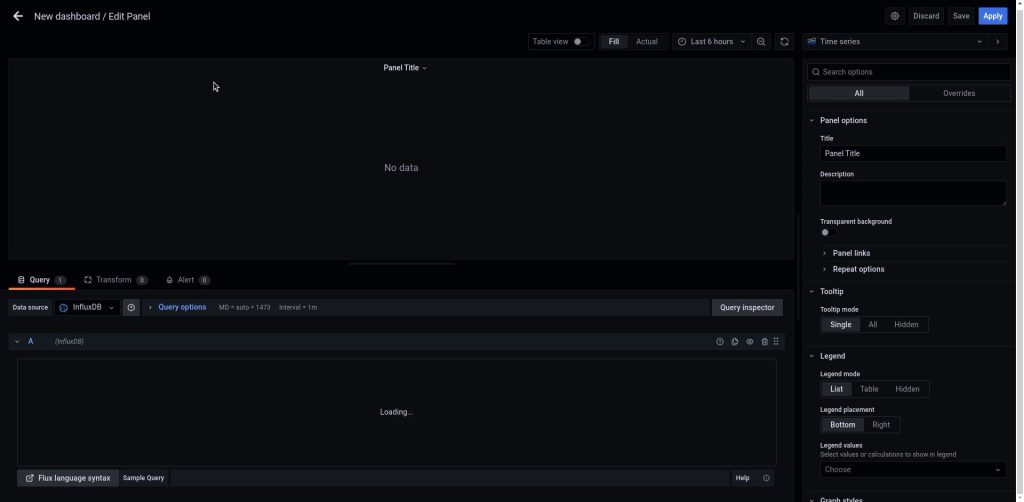
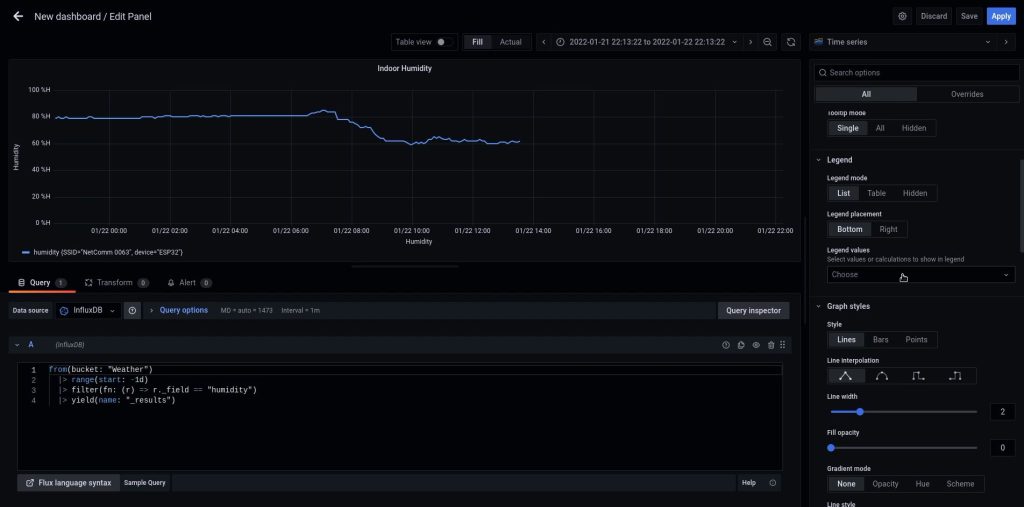
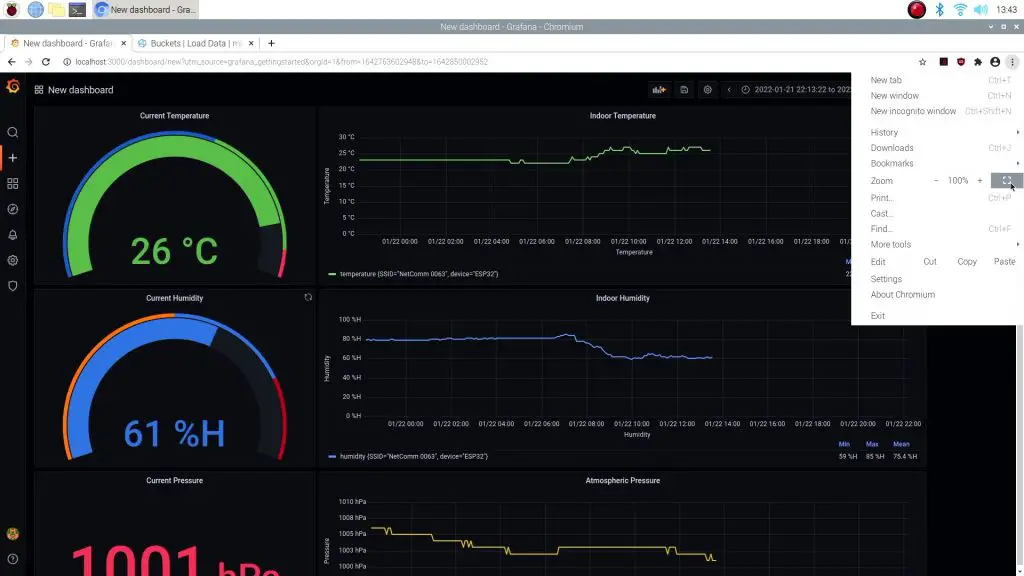
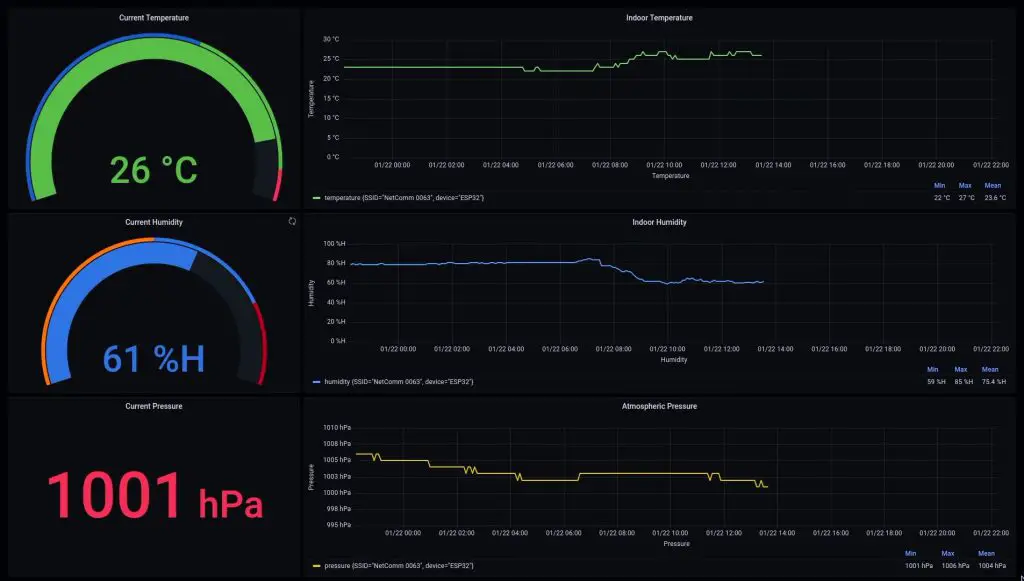
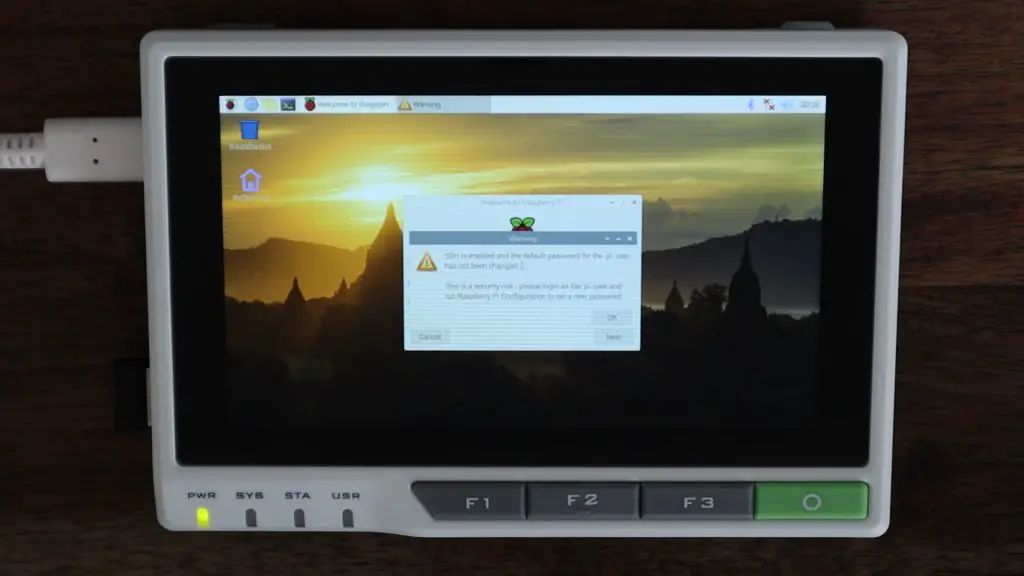
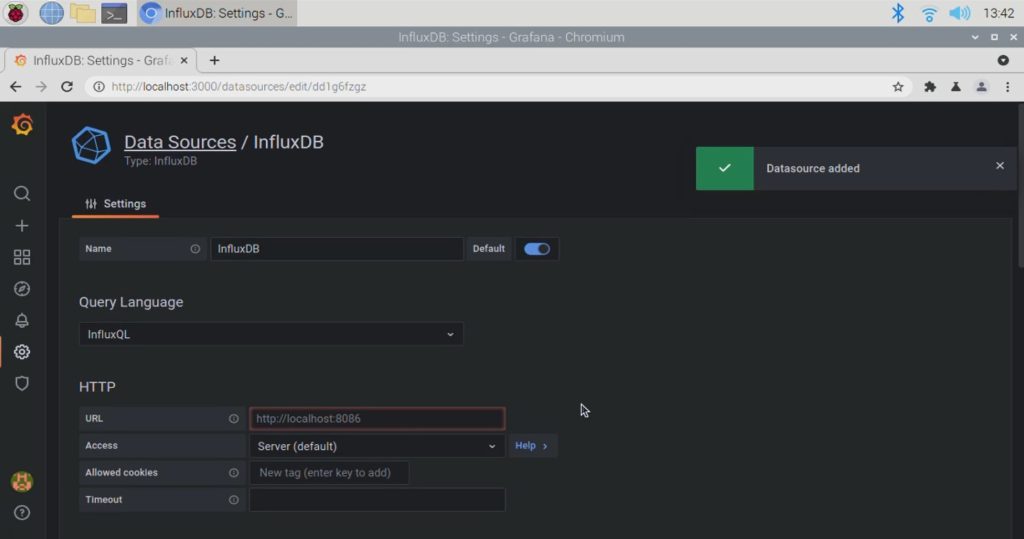
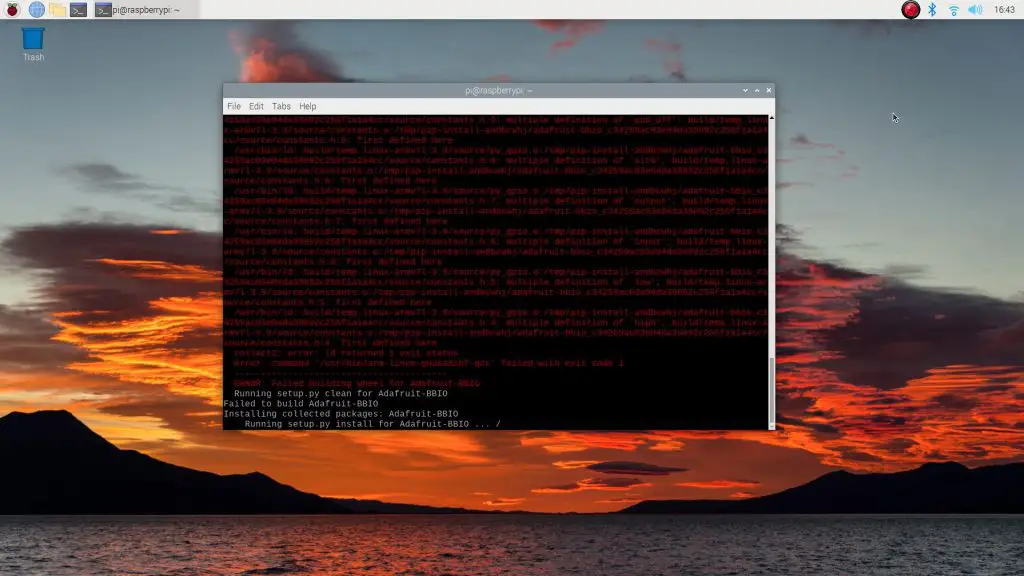
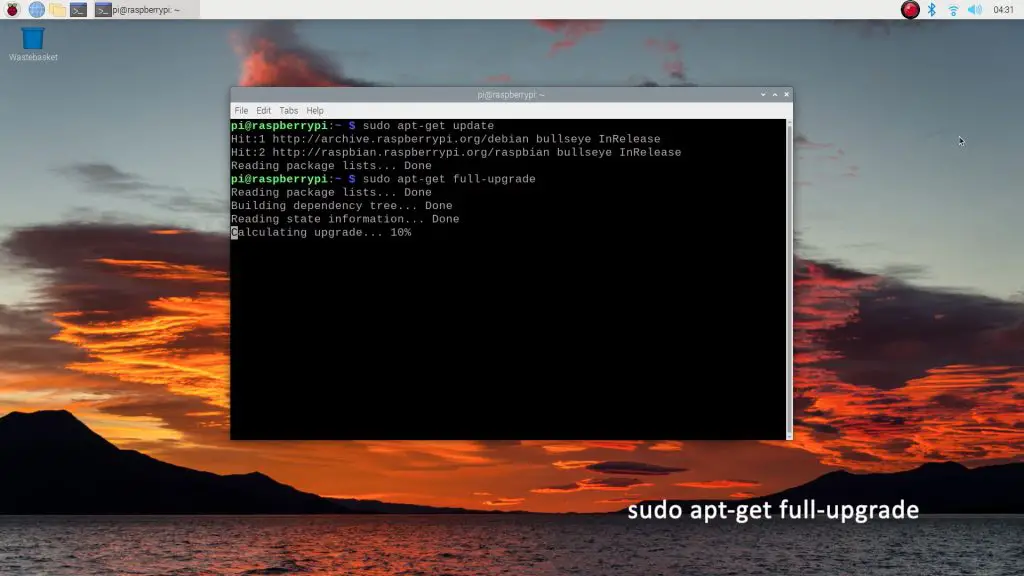
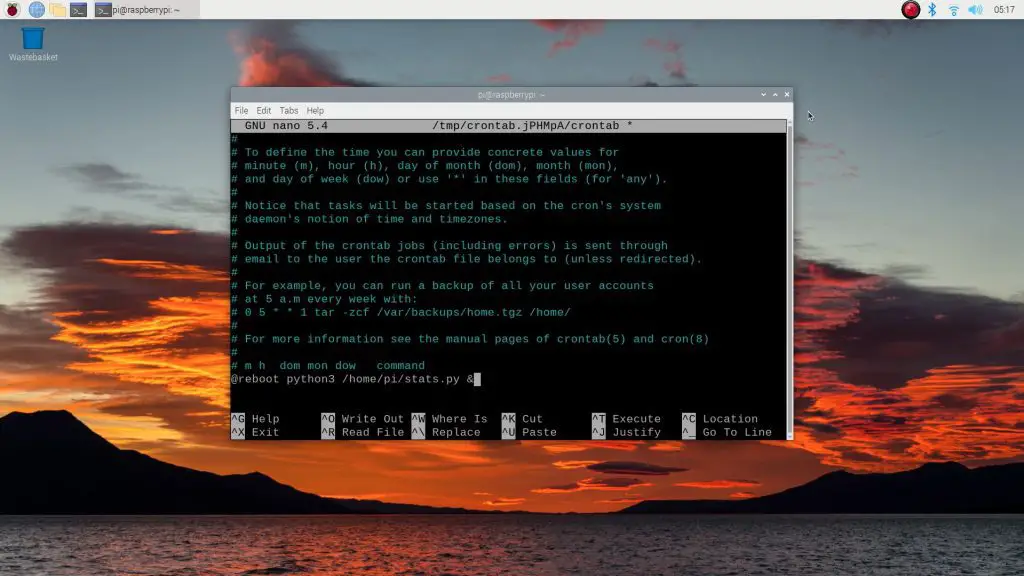
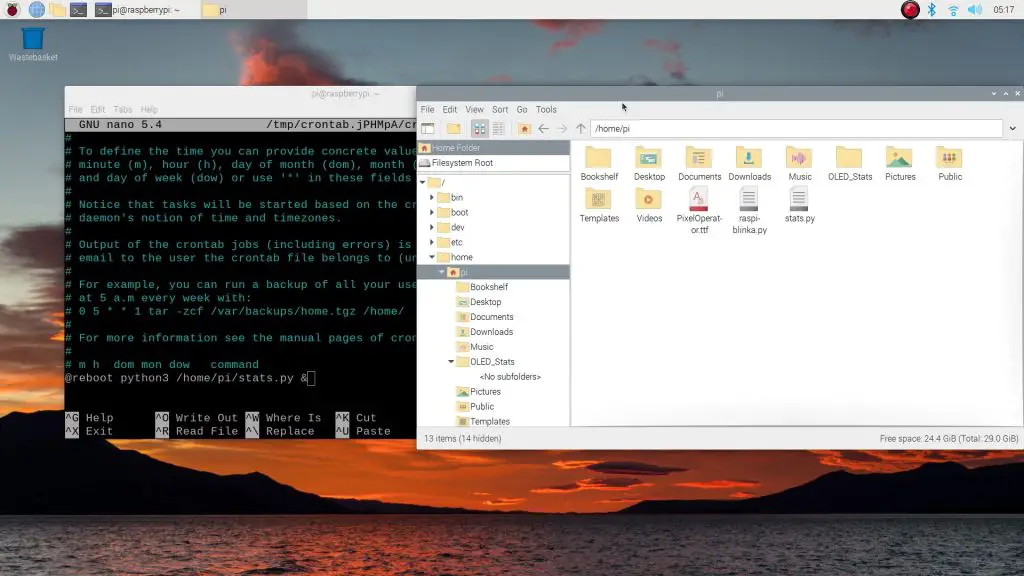
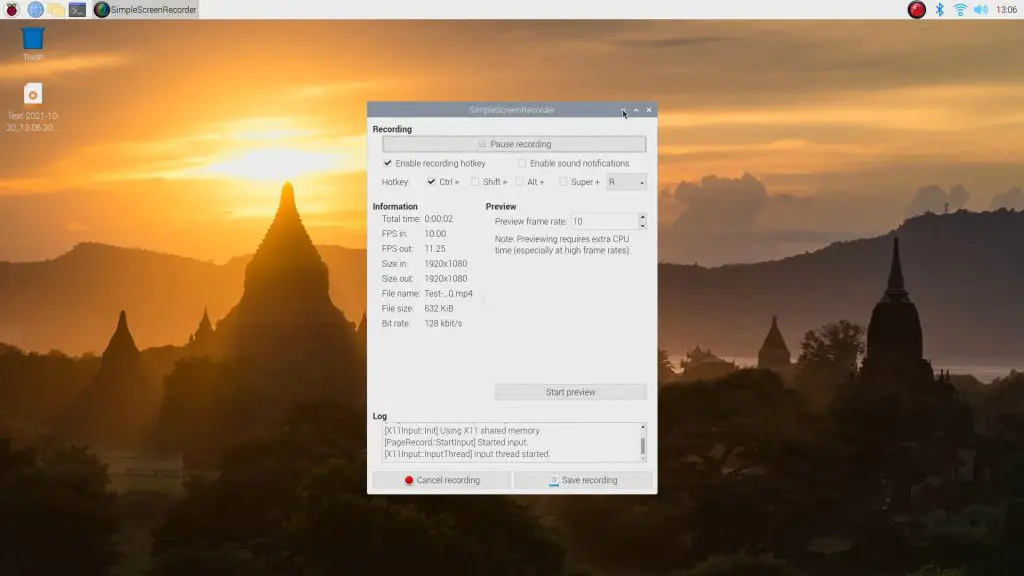
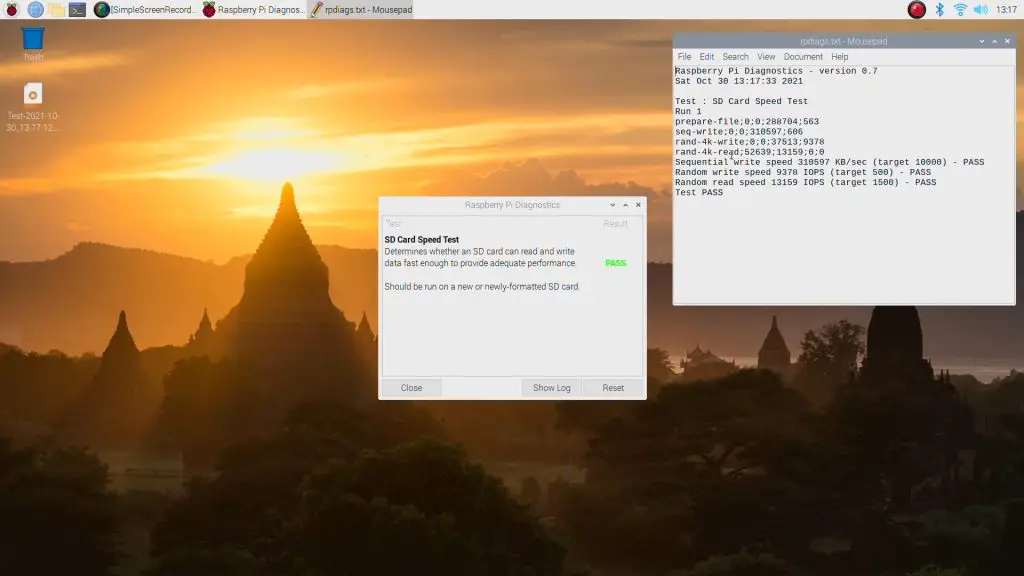
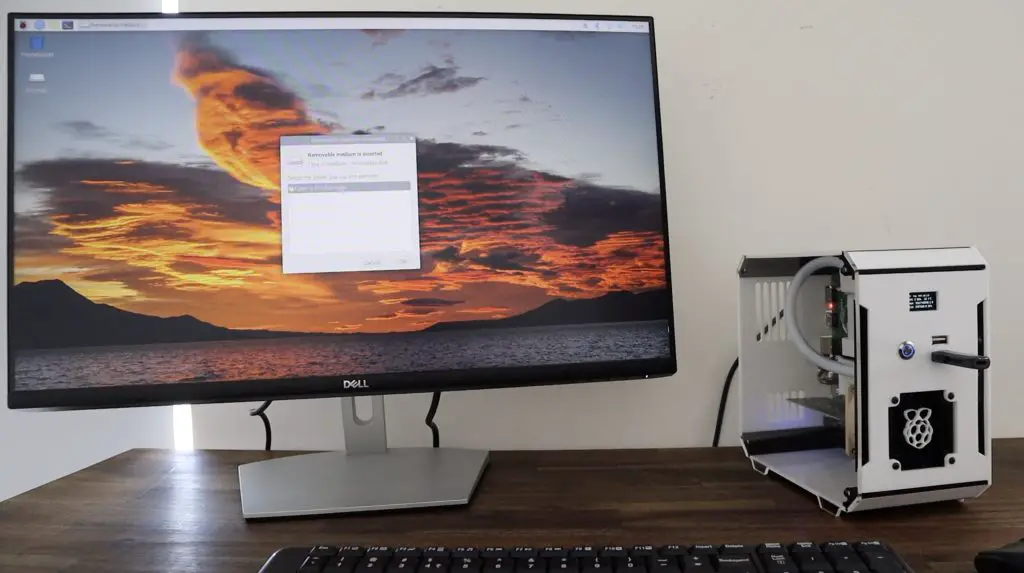
I’m running Raspberry Pi OS Bullseye on the Pi and I obviously had to do some additional setup to get it booting off the NVME drive, to get the display working and even just to activate the USB ports because they’re disabled by default.
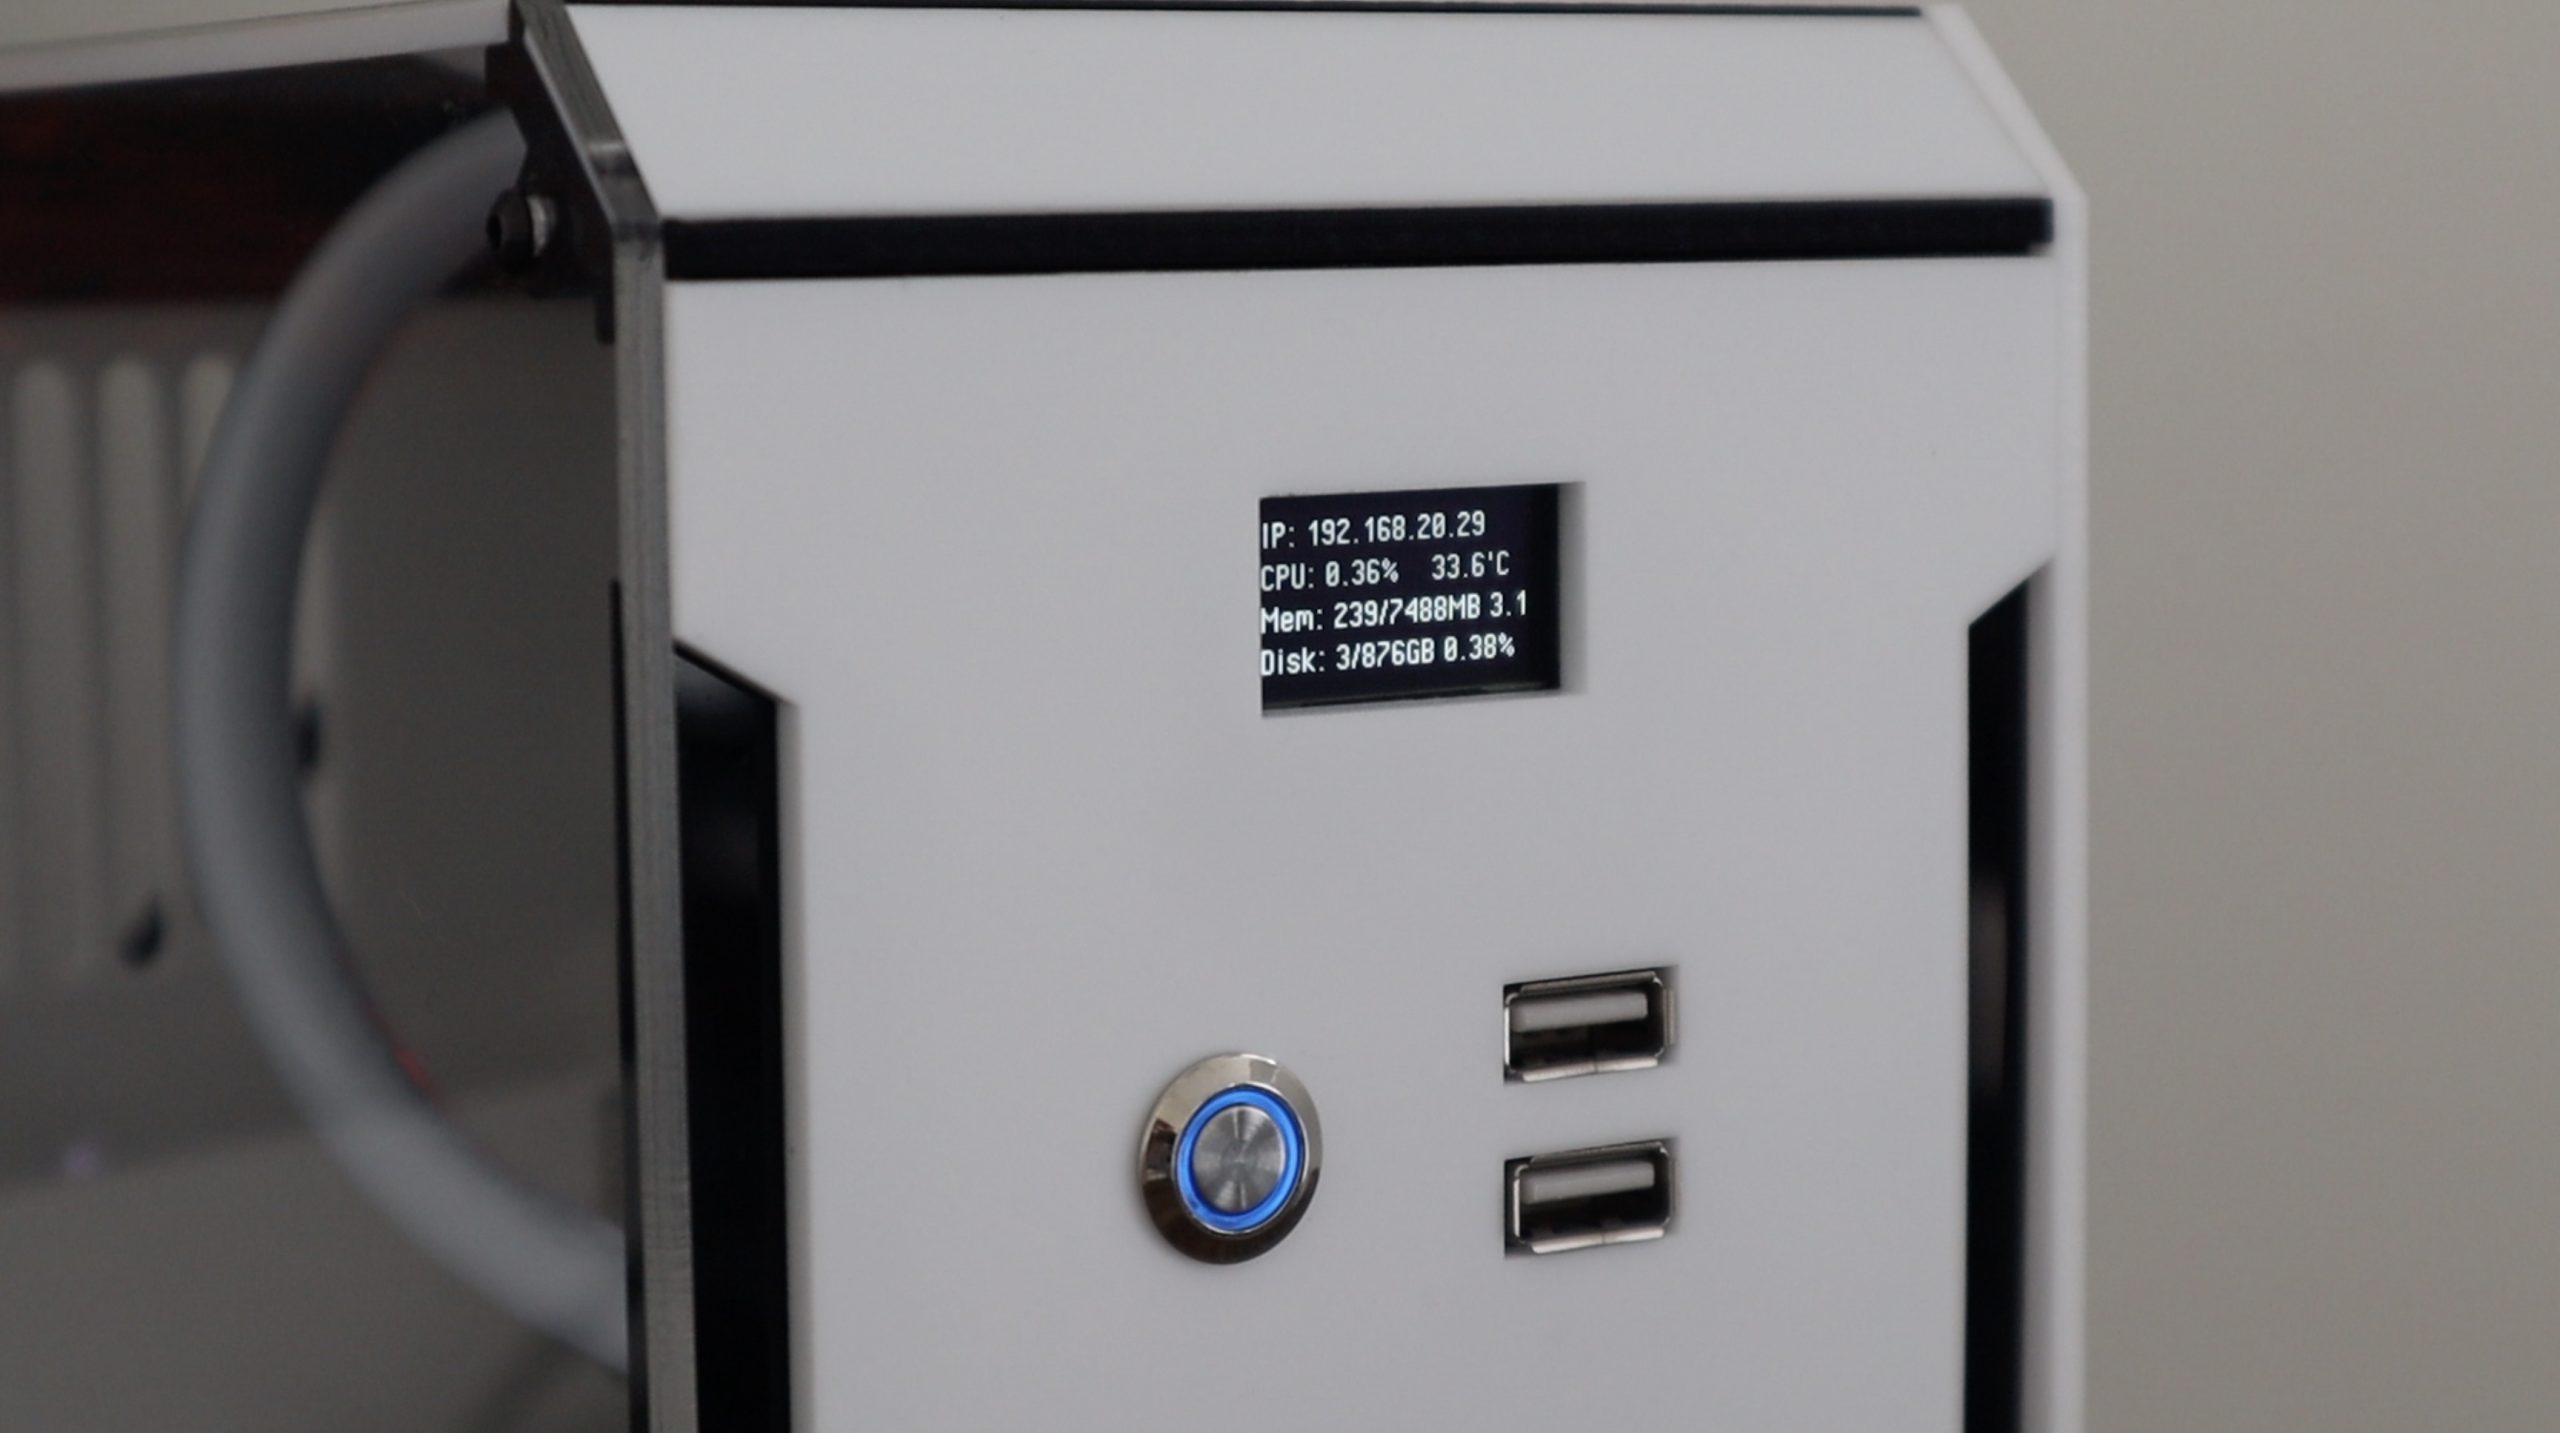
But it’s all working correctly now and I can use the front USB ports for basic interfaces. I haven’t read too much into the documentation but I suspect that these are only USB 2.0 ports. That’s ok for using them for accessing documents and small files on a flash drive or using basic USB peripherals.
Let me know what you think of the Raspberry Pi computer build in the comments section below! Is there anything you think I missed or should have done differently? I was thinking of maybe bringing out the GPIO pins to one of the 3D printed corner pieces, perhaps one of the two at the top?