Raspberry Pi OS Bookworm has been out for a little over a year now. It comes with a few visual changes like a Wayland native taskbar with plugins like a CPU and GPU monitor, and a new default background, but far more changes have been made under the hood. One of these changes is the requirement to use a virtual environment to install third-party packages with pip rather than installing them system-wide. This places packages in a managed space instead of at system level, which lowers the risk of causing conflicts or breaking other software packages or the operating system.

Unfortunately, this change along with a few tweaks to the way the GPIO pins are used has made my previous tutorial for installing an OLED stats display on a Pi 4 outdated. If you try to follow this tutorial you’ll end up with a number of errors around virtual environments and broken libraries.
So today I’m going to run through how to connect and program and OLED stats display on a Raspberry Pi 5 running PI OS Bookworm.
Here’s my video tutorial, read on for the written tutorial;
What You Need For This Project
- Raspberry Pi 5 – Buy Here
- Raspberry Pi 5 Power Supply – Buy Here
- 32GB MicroSD Card – Buy Here
- I2C OLED Display (128×64) – Buy Here
- 4-Wire Female to Female Jumper Cable – Buy Here
- Ice Tower Cooler – Buy Here
Note: The above parts are affiliate links. By purchasing products through the above links, you’ll be supporting this channel, with no additional cost to you.
Connect the OLED Display to Your Raspberry Pi
To start out, let’s get the OLED display connected to our Raspberry Pi.
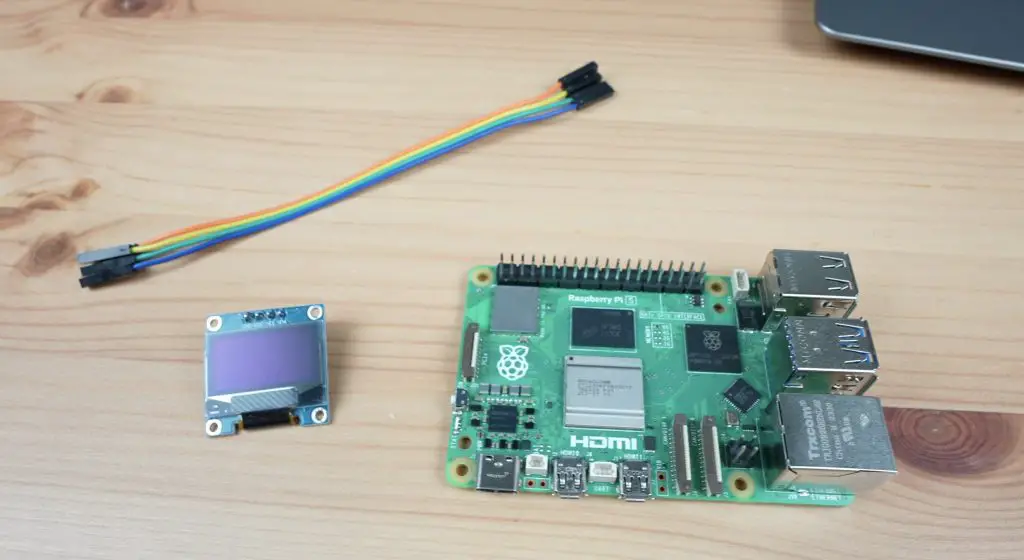
To do this, you’ll need a 4-wire female-to-female jumper cable. The colours don’t matter, they just help you to keep track of which wire goes to which terminal.
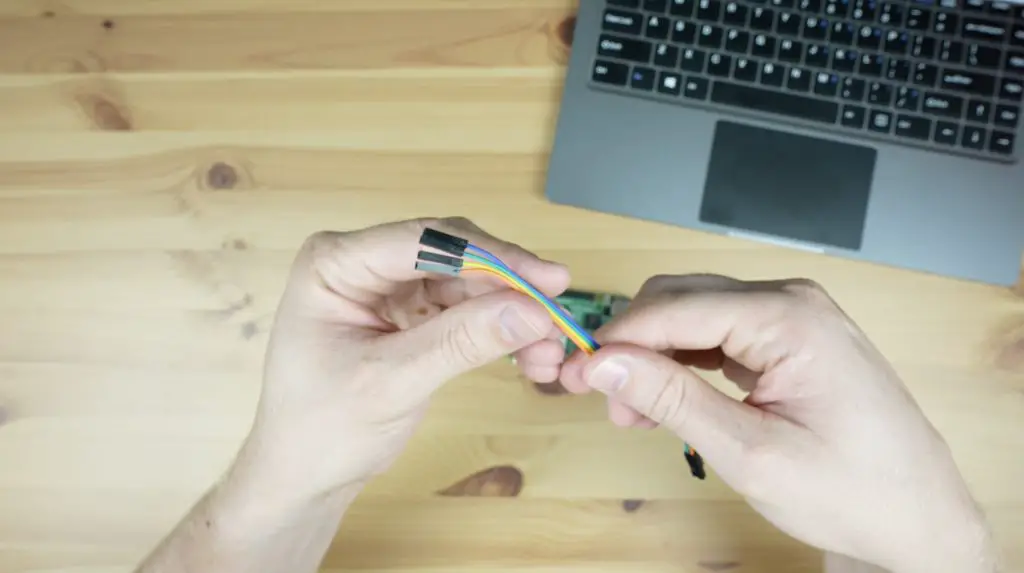
The OLED display’s terminals are labelled on the front, so make sure that you take note of them or label the wires before installing it in a case or you won’t be able to see them.
The pin arrangement on these displays is most commonly GND, VCC, SCL and SDA.
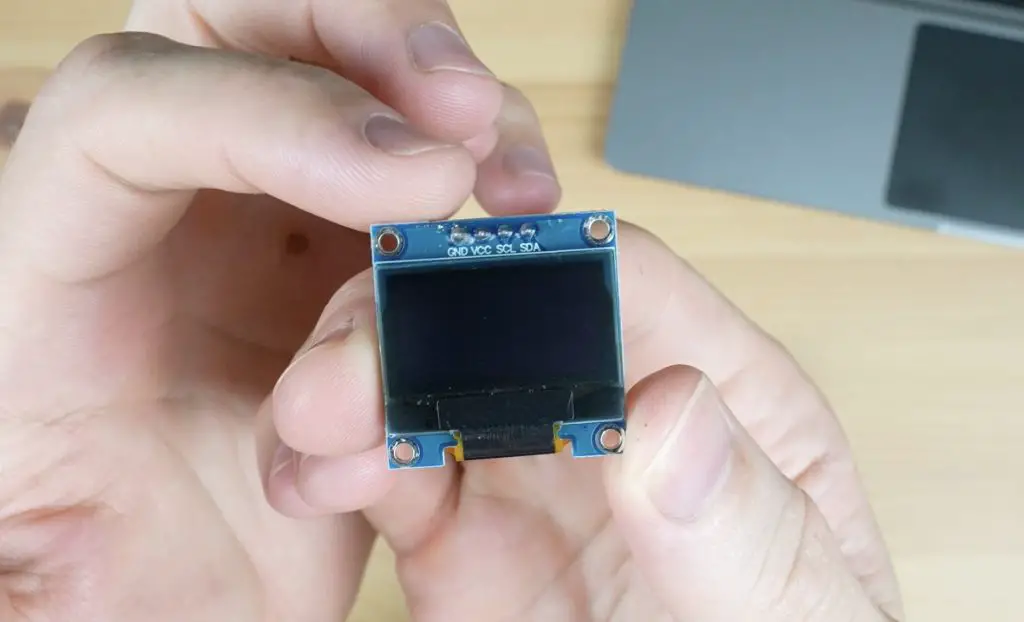
You can’t just copy this arrangement though as there are versions of this display that have the GND and VCC pins switched around.
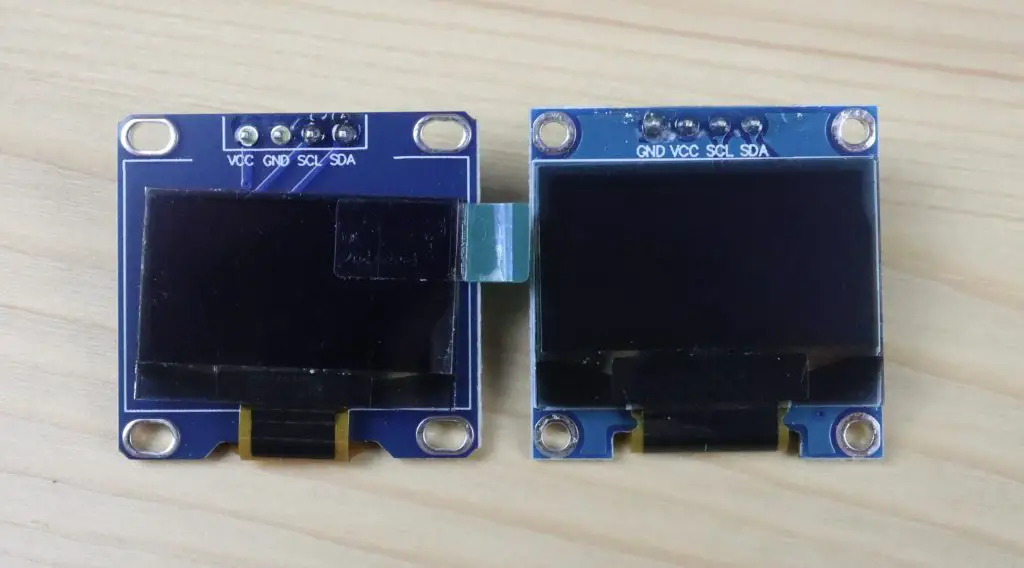
If you connect power to the display incorrectly, even just a single time, you’ll likely damage it and it will no longer work, even if you correct the wiring afterwards – ask me how I know this.
Plug your jumper cable into these four pins and then take note of which colours you’ve got connected to which pins.
Next, we can plug the other ends into our Raspberry Pi’s GPIO pins. Make sure that your Pi is off and power is disconnected before doing this, you don’t want to short a connection or plug a lead into an incorrect pin and not have a chance to check the connections before powering it up.
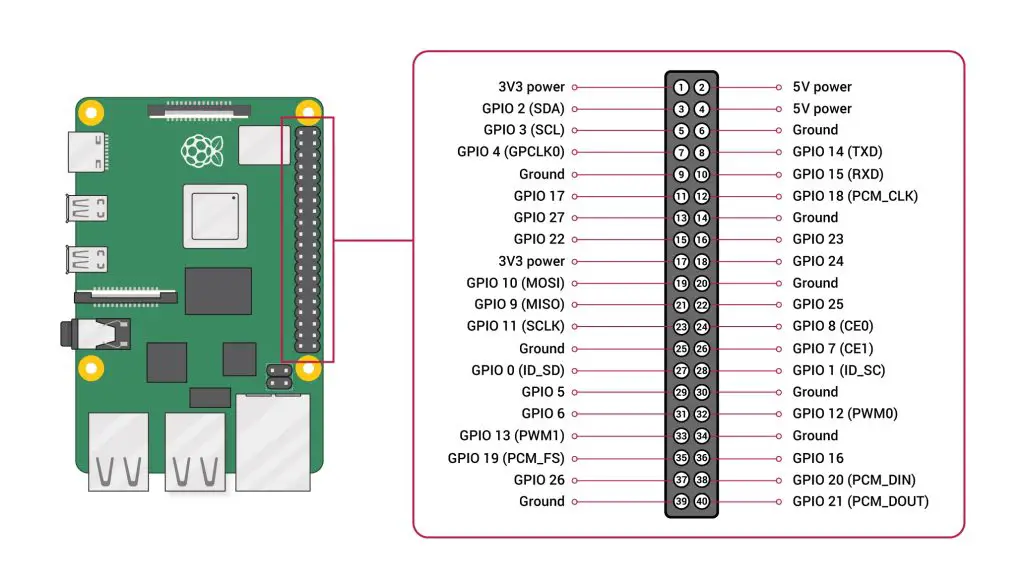
There are a few options for the power pins. I usually plug the GND jumper into pin 9 and the VCC jumper into pin 1. You can use any of the pins labelled ground for the ground jumper and these displays will run on 3.3V or 5V so you can use any of these labelled pins for the VCC jumper.
- GND to Pin 9 (Ground)
- VCC (3.3V) to Pin 1 (3.3V)
- SCL to Pin 5 (GPIO 3)
- SDA to Pin 3 (GPIO 2)
Next, we need to connect the SCL and SDA jumpers, which just get plugged into the corresponding GPIO pins. Plug SCL into pin 5 and SDA into pin 3. Don’t get mixed up with the GPIO numbers and Pin numbers, I’m working off the physical pin numbers.
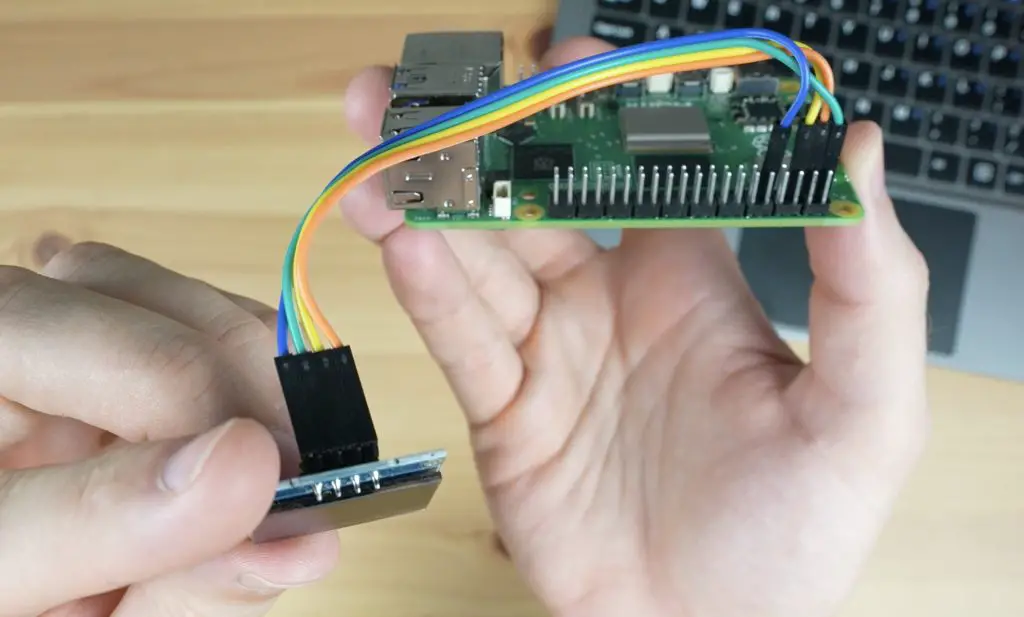
Quickly recheck your connections and we can then start programming the display.
Programming The OLED Stats Display
I’m going to be working on a fresh 64-bit install of Raspberry Pi OS Bookworm, which you can flash to your microSD card or SSD using Raspberry Pi Imager.
Plug the microSD card into your Pi’s card reader and then plug in your power adaptor to boot it up.
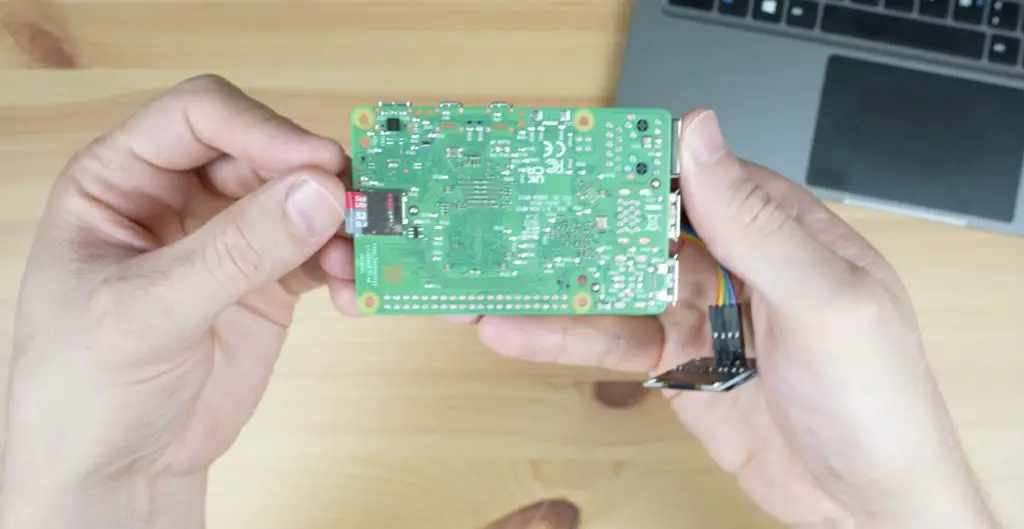
If this is your first boot, you’ll need to go through a few setup steps and you’ll then land on the desktop.
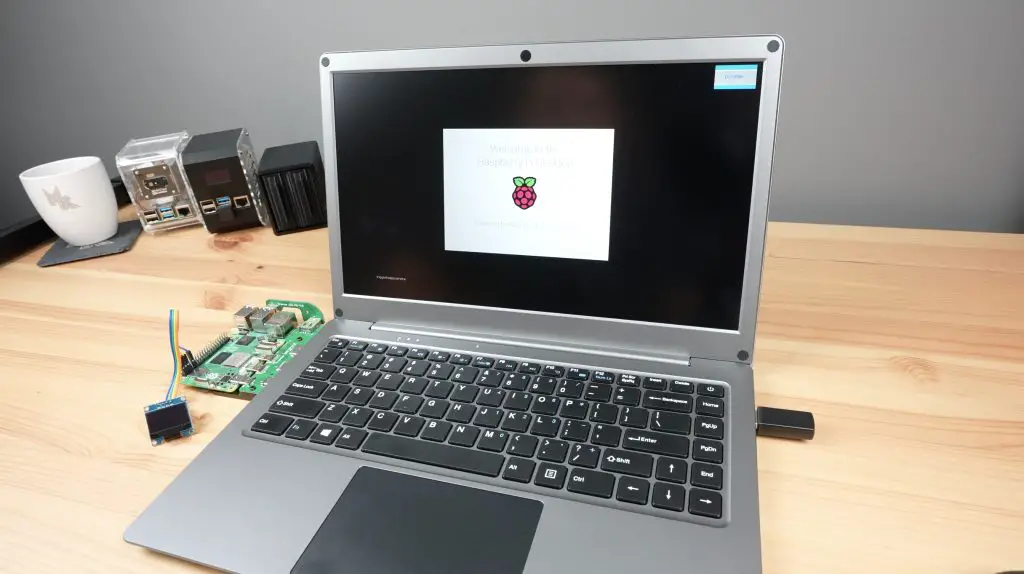
It’s possible to do this installation on a headless Pi too as we’ll only be working in the terminal.
Updating The Pi & Installing Libraries
Open up a new terminal window or SSH into your headless Pi and we’ll start by making sure that the Pi is up to date by entering the following commands. When the updates are finished installing, reboot the pi.
sudo apt-get update
sudo apt-get -y upgrade
sudo reboot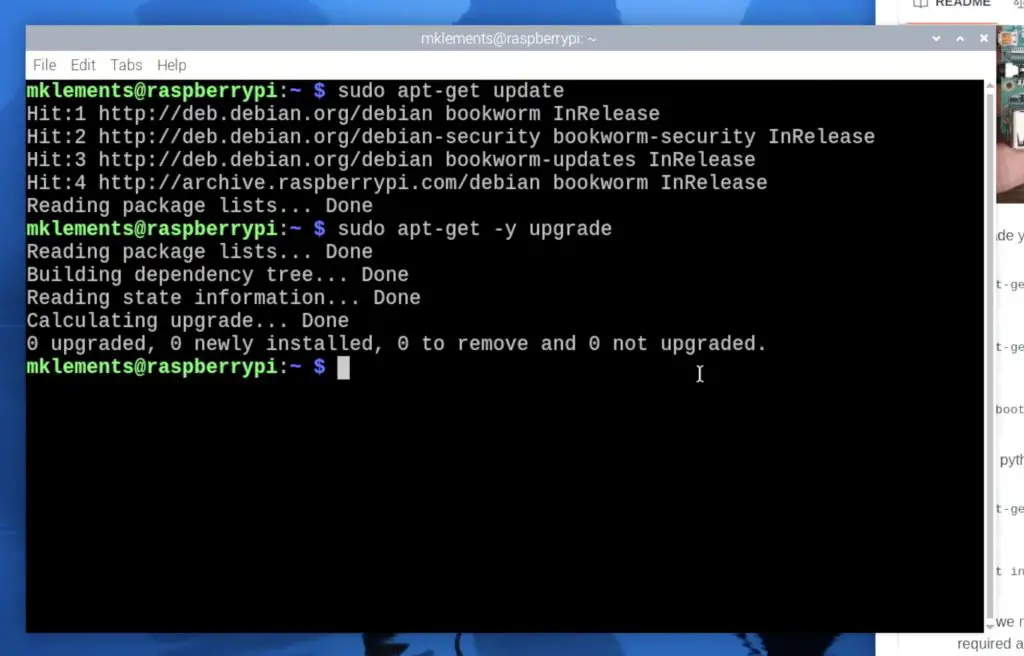
Once rebooted, open up the terminal again and then enter these commands to install two libraries.
sudo apt-get install python3-pip
sudo apt install --upgrade python3-setuptools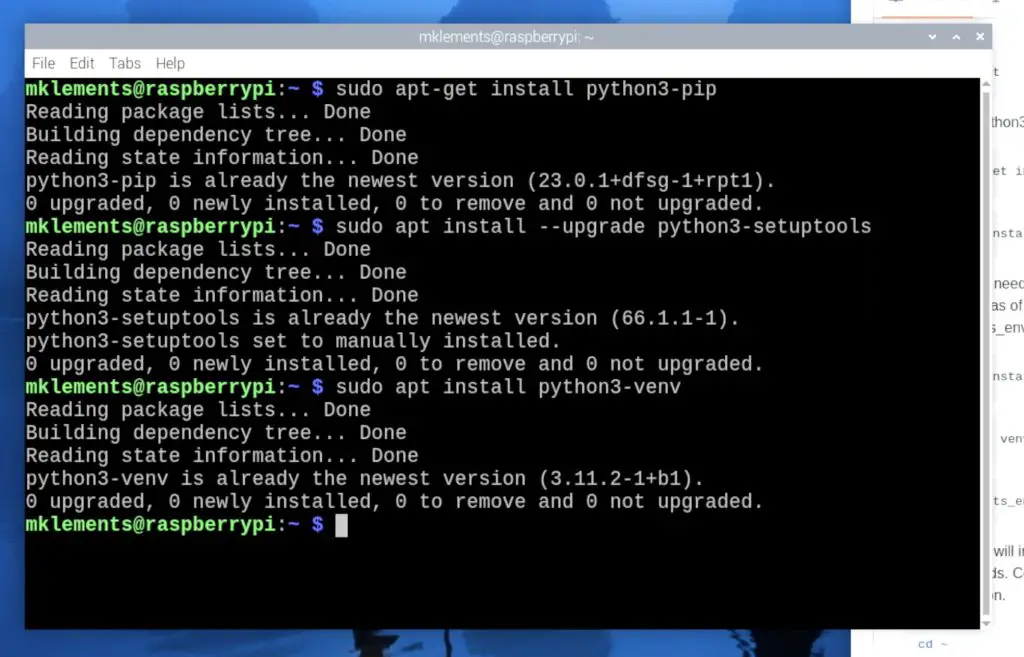
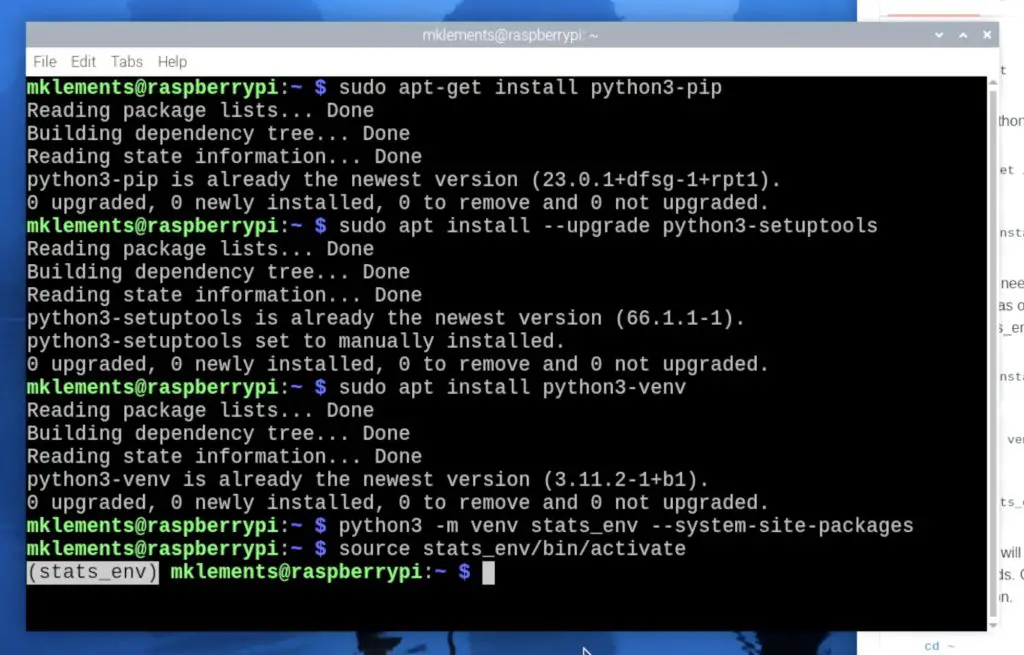
Now we need to create a virtual environment to continue the setup in. We’ll call this stats_env.
sudo apt install python3-venv
python3 -m venv stats_env --system-site-packages
source stats_env/bin/activate
Once activated, you should see stats_env at the start of your current terminal line.
Next, let’s install the Adafruit Blinka library. Once complete, confirm yes at the end to reboot your pi.
cd ~
pip3 install --upgrade adafruit-python-shell
wget https://raw.githubusercontent.com/adafruit/Raspberry-Pi-Installer-Scripts/master/raspi-blinka.py
sudo -E env PATH=$PATH python3 raspi-blinka.py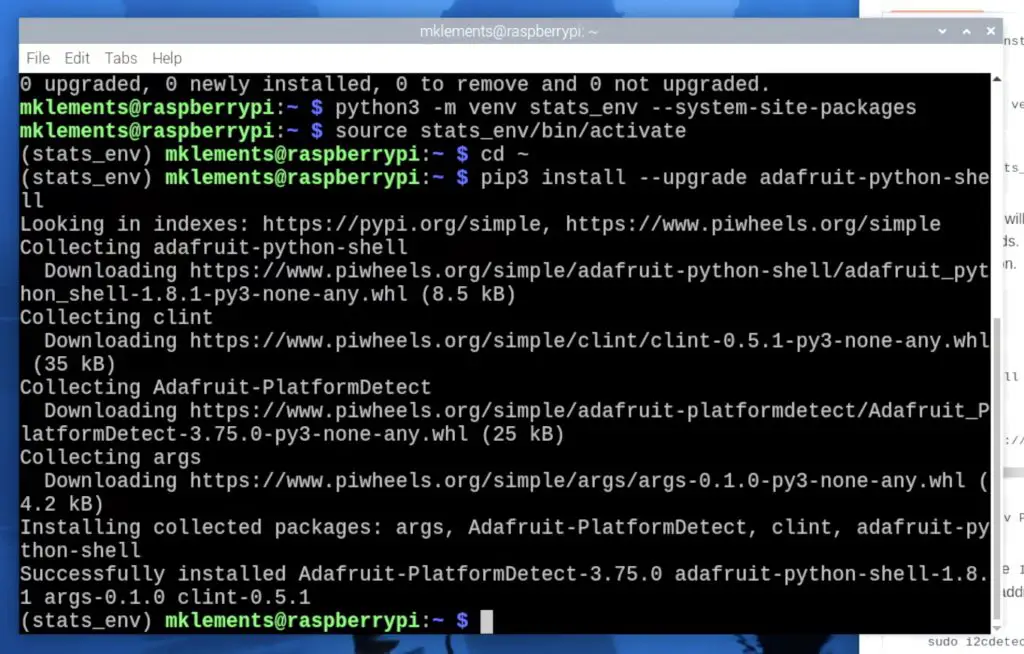
With the Pi rebooted, let’s now check that it can see the connected display. Enter this command and you should then see an address table and importantly you should get the characters 3c in the top right area of the table.
sudo i2cdetect -y 1 0 1 2 3 4 5 6 7 8 9 a b c d e f
00: -- -- -- -- -- -- -- --
10: -- -- -- -- -- -- -- -- -- -- -- -- -- -- -- --
20: -- -- -- -- -- -- -- -- -- -- -- -- -- -- -- --
30: -- -- -- -- -- -- -- -- -- -- -- -- 3c -- -- --
40: -- -- -- -- -- -- -- -- -- -- -- -- -- -- -- --
50: -- -- -- -- -- -- -- -- -- -- -- -- -- -- -- --
60: -- -- -- -- -- -- -- -- -- -- -- -- -- -- -- --
70: -- -- -- -- -- -- -- --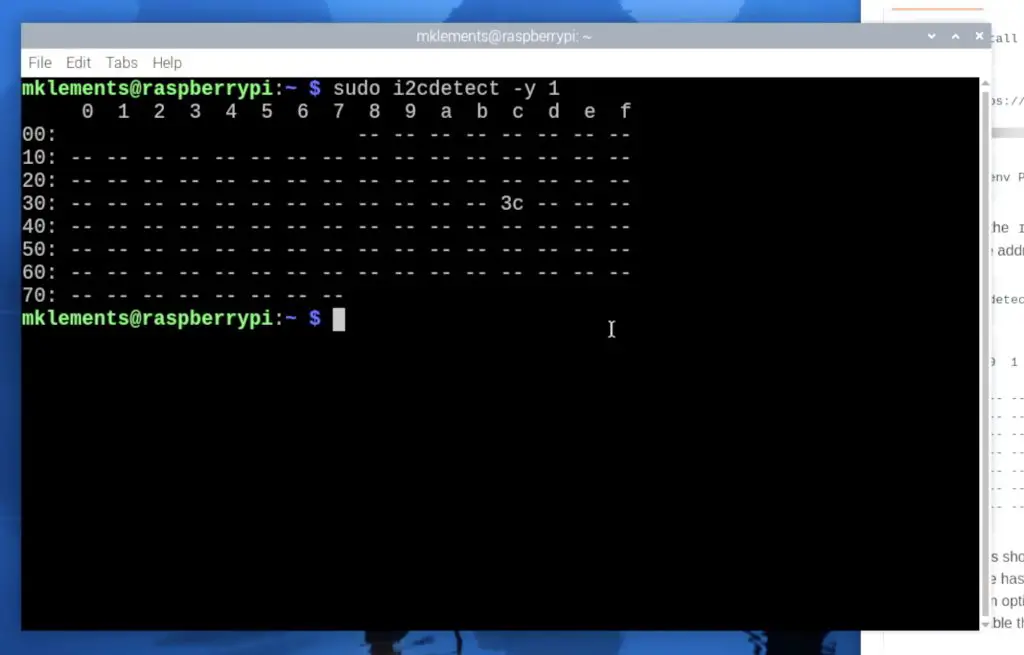
If you don’t see any characters in the table then your Pi isn’t recognising the connected display. First, check your display is connected correctly and then make sure that the I2C interface is enabled. If you get a table full of characters then you’ve probably made a wiring mistake as this happens if SDA is shorted to ground.
To check that the I2C interface is enabled, use the below command to open up configuration options, then select “3 Interfacing Options”, then select “I5 I2C”, “Yes” to enable the interface, “Ok” and then “Finish”
sudo raspi-configNext, we can install the CircuitPython libraries specific to this display. We start by re-entering the virtual environment and then enter these commands to install the libraries.
source stats_env/bin/activate
pip3 install --upgrade adafruit_blinka
pip3 install adafruit-circuitpython-ssd1306
sudo apt-get install python3-pil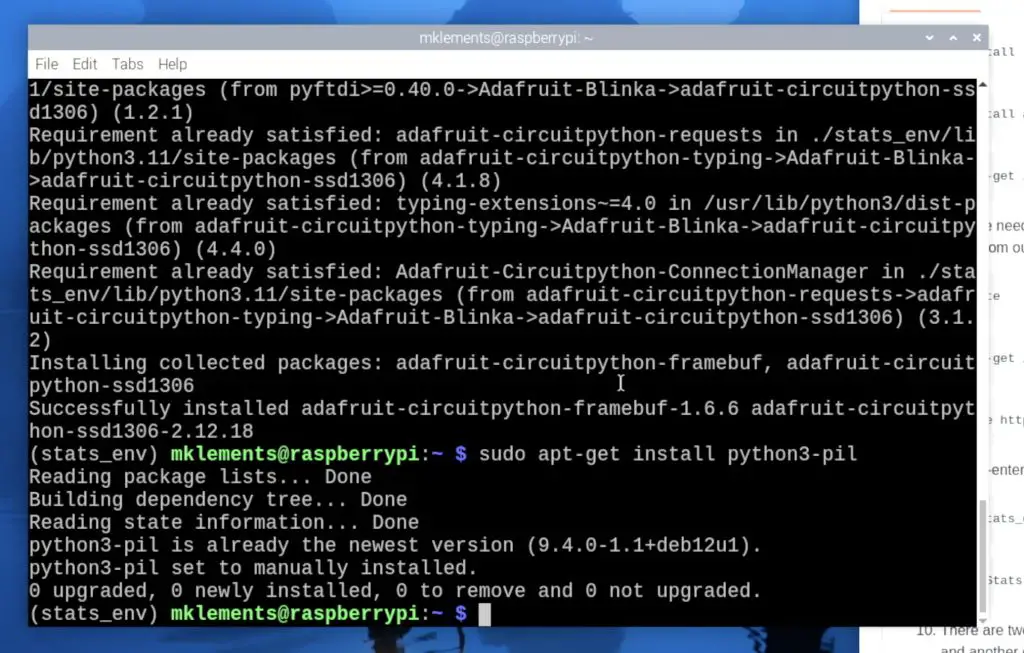
Running The Stats Script
We can then exit the virtual environment and download the stats display Python script from my GitHub repository.
deactivate
sudo apt-get install git
git clone https://github.com/mklements/OLED_Stats.git
We then need to re-enter the virtual environment to run the script.
source stats_env/bin/activate
cd OLED_Stats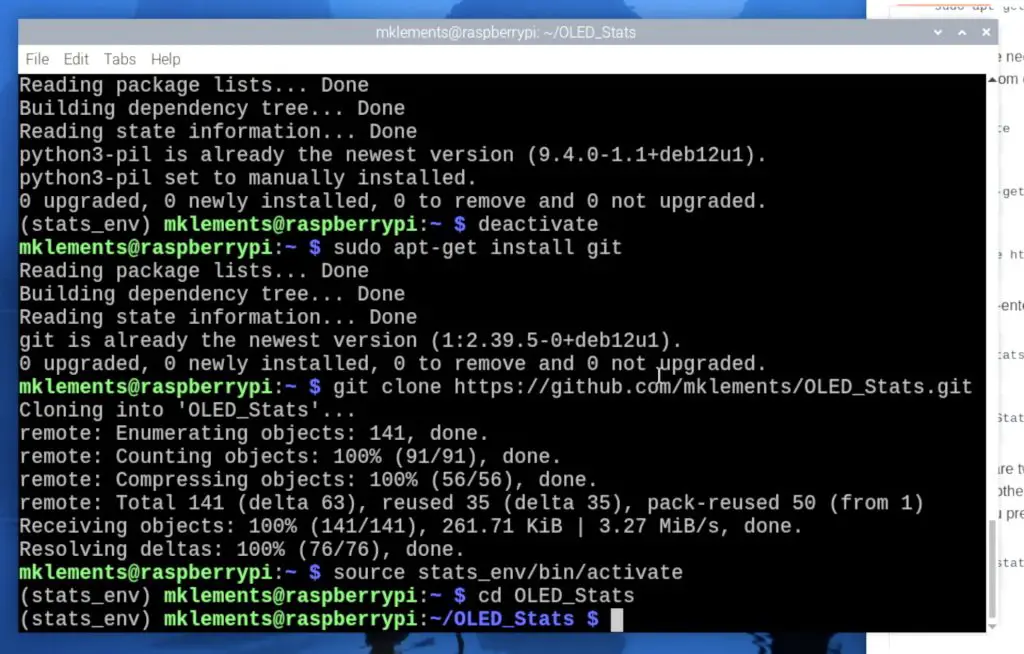
There are two options for scripts to run. The first is a text-based one called stats.py and the second is one with icons called monitor.py. You’ll need to change the filename in the run command depending on which one you’d like to run.
python3 stats.py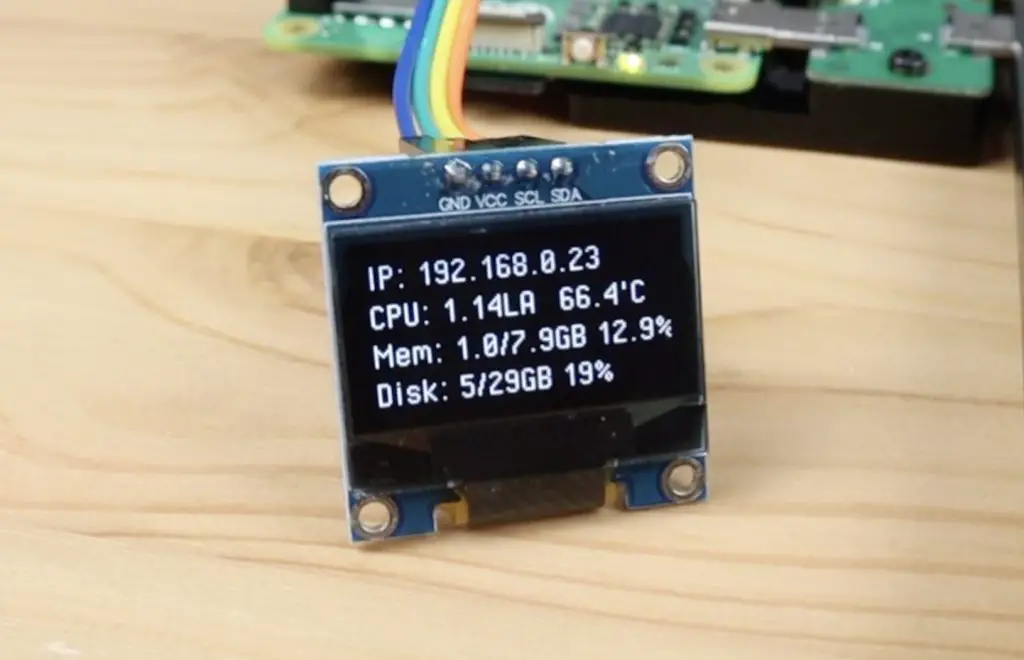
or
python3 monitor.py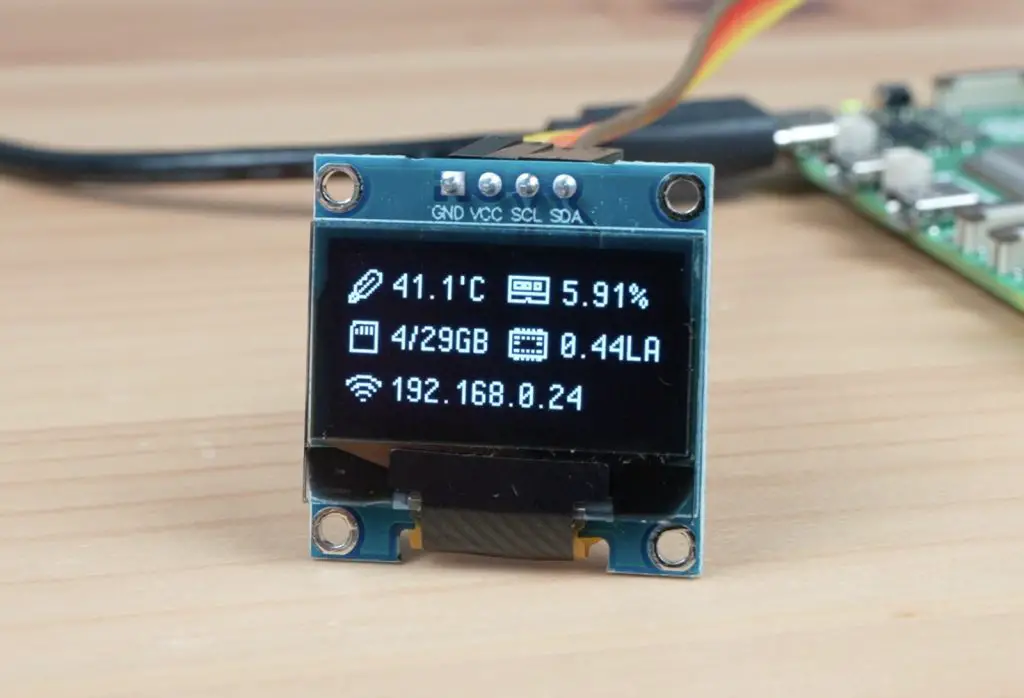
The script is now running and your display should show your IP address and system stats.
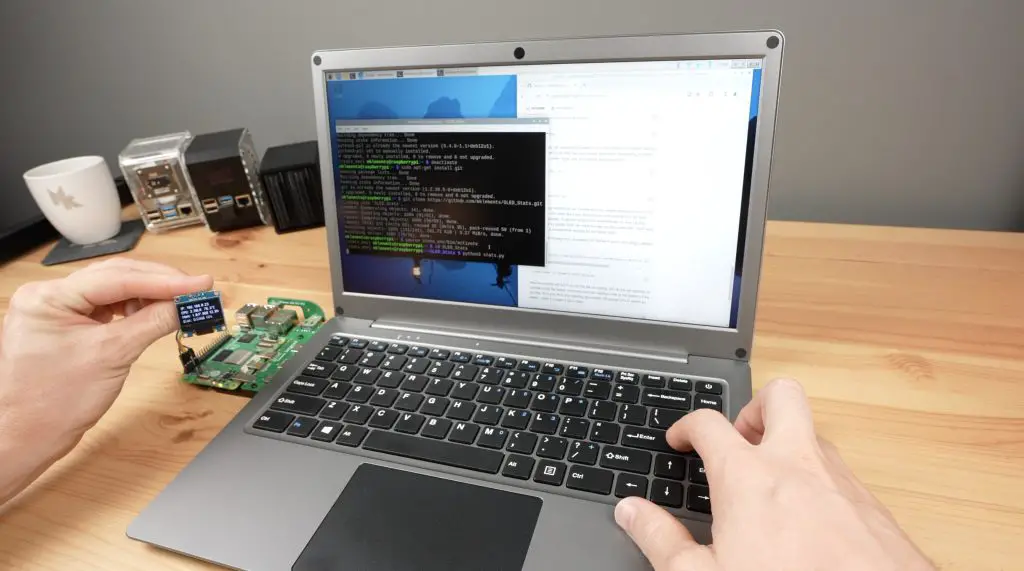
We can’t leave it like this though, if we close the terminal or reboot the Pi, the script will terminate and the display will stop being updated. So we need to follow some additional steps to get the script to run automatically on startup.
Programming The Pi To Run The Script On Startup
This is quite easy to do, we just need to copy this file from my GitHub repository into the root directory, then make it executable and then use crontab to tell it to run on startup. You’ll need to open a new terminal window for the below steps. Remember to change your username (“pi” below) if you’re not using a default username
curl -OL https://raw.githubusercontent.com/mklements/OLED_Stats/main/OLED_display
sudo chmod +x /home/pi/OLED_display
The OLED_display script runs the stats.py file by default. To change this to the monitor.py file, you’ll need to open it up in a text or code editor and change the target filename from stats.py to monitor.py.
Open up crontab by entering this command. If this is the first time you’re opening crontab then you’ll be prompted to select an editor, select 1 and hit enter.
crontab -e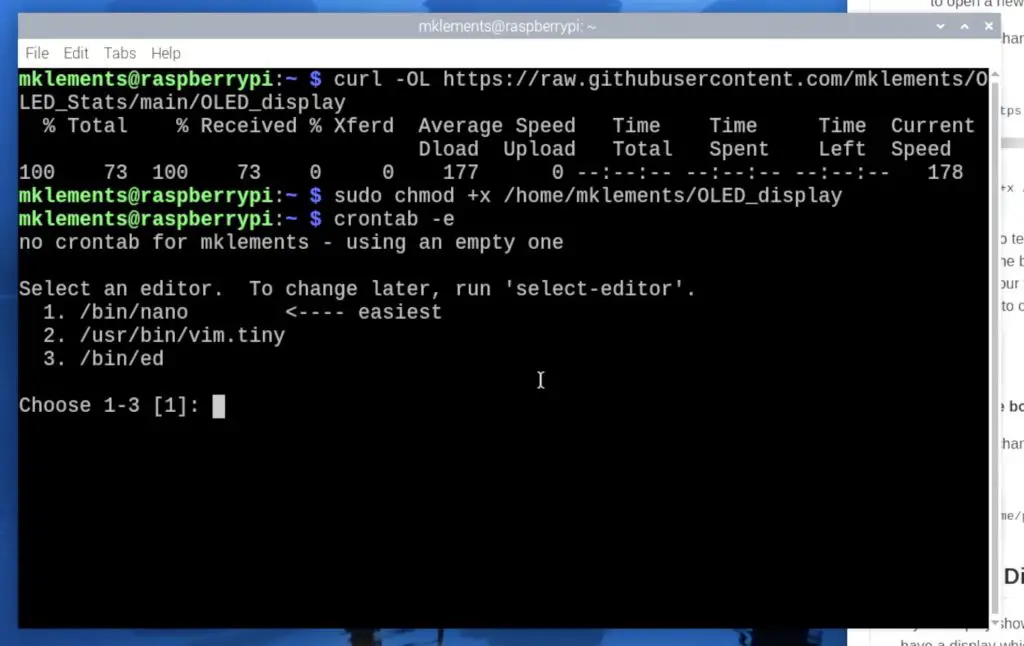
Then add this line to the end of the file. Make sure to change your name to your username if you’re not using the default username pi.
@reboot /home/pi/OLED_display &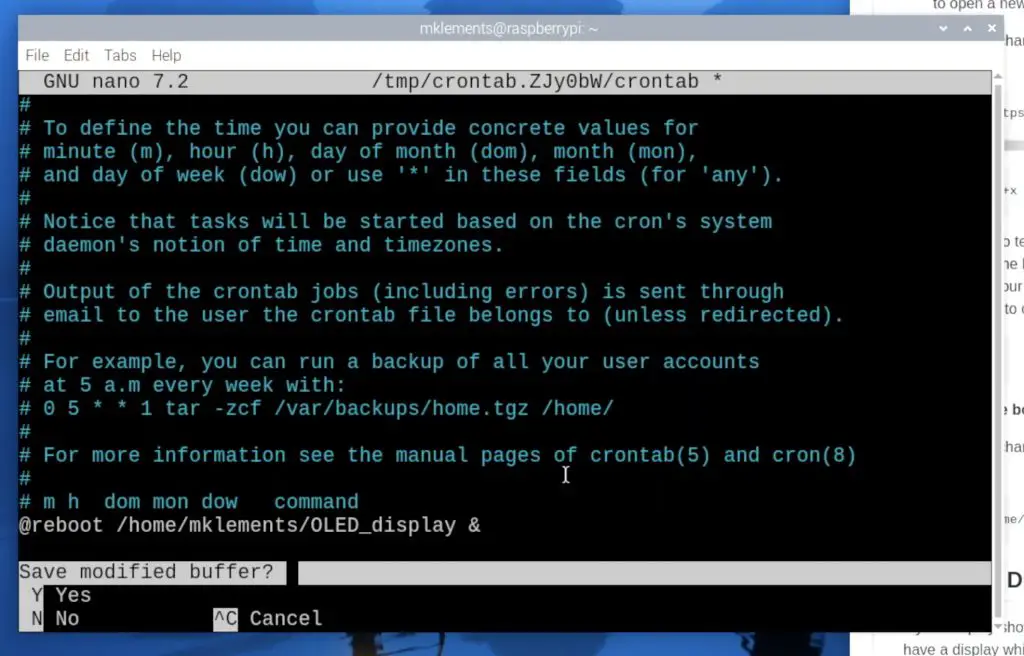
You should now have a working OLED stats display that starts up automatically each time your pi boots up.
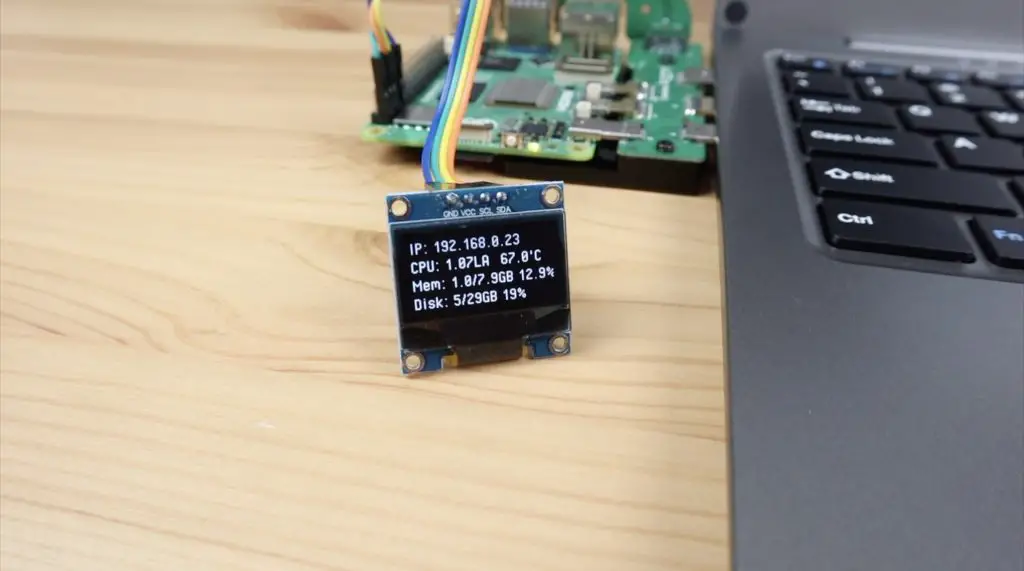
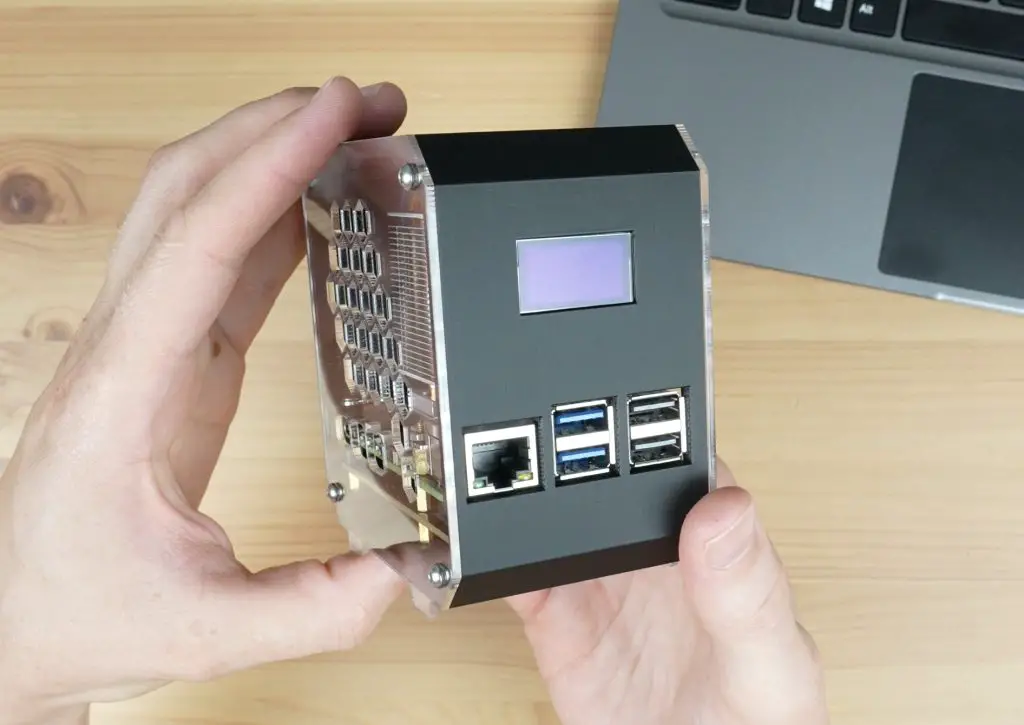
You can go ahead and install it into your case if you haven’t done so already. My favourite case at the moment is my Pimoroni NVMe case which accommodates an NVMe drive underneath the Pi and an Ice Tower for cooling.
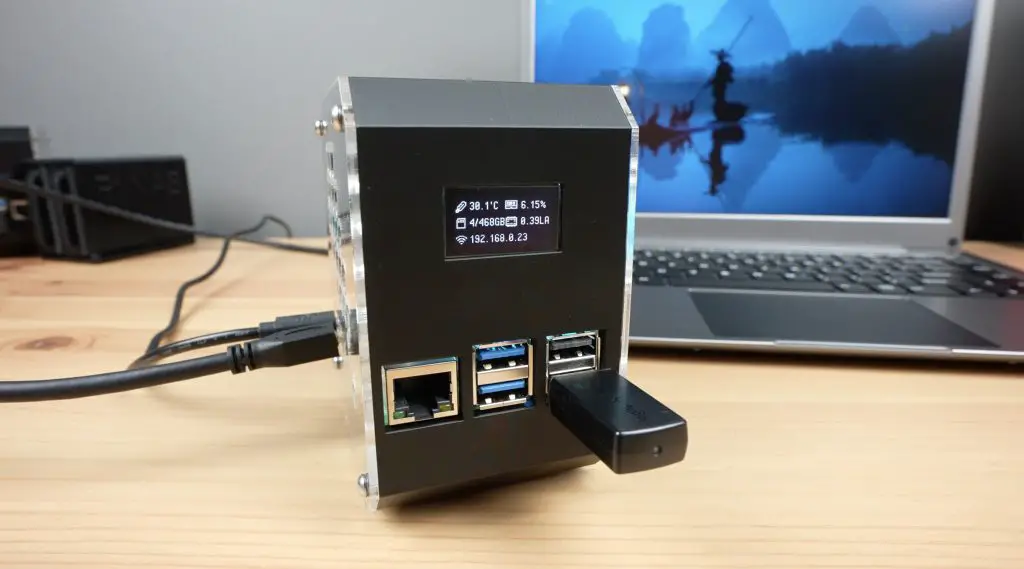
Let me know what you’re using your OLED stats display for in the comments section below, or if there’s anything you’d like to see added to the display script in the future.


This is really great. Thanks for sharing. Being that I am from the US can you reply with the replacement code for Temp but in fahrenheit?
The Pi reports temperature in celsius by default and it is text based, so you’d need to isolate and convert it to a number, then convert it to farenheit and then back to text. The below should work. You also need to change the display line to now use temp_display rather than str(Temp, ‘utf-8’)
temp_celsius = float(Temp.decode(‘utf-8’).strip().replace(“‘C”, “”))
temp_fahrenheit = (temp_celsius * 9 / 5) + 32
temp_display = f”Temp: {temp_fahrenheit:.1f}°F”
Thank you for the excellent video and tutorial!
I assume the code you are talking about is in the .py file from git hub. I think you put the above code after the call to get the temperature?
Hi Michael, Thanks for sharing the updated OLED STATS for Bookworm. I would like to use them on a 1.3″ SH1106 Oled display. What would I need to do differently?
There is a bit of work involved to use a different display. To use a SH1106 OLED display instead of the SSD1306 in the original script, you need to:
Use a library that supports the SH1106 driver.
The adafruit_ssd1306 library only supports SSD1306 displays. For SH1106, you have two main approaches:
Option A: Use Adafruit’s DisplayIO-based SH1106 Library
Install the adafruit_displayio_sh1106 library.
Adjust your code to use displayio for rendering graphics and text.
Option B: Use the Luma.OLED Library
Install luma.oled (if not already installed).
Change the import statements and initialization to use luma.oled’s sh1106 device class.
This is great thanks Michael.
Is there a version of the script that works with the UPS from your previous UPS case example?
Thanks.
That particular UPS is not officially compatabile with the Pi 5 due to the higher power requirements. I’m looking at updating a script to go with the new version of that UPS.
I ran into an issue with numa.oled running on Raspberry Pi5
RuntimeError: Cannot determine SOC peripheral base address
These commands fixed the issue
sudo apt remove python3-rpi.gpio
pip3 install rpi-lgpio
I meant luma.oled library
There are many demo scripts available here
https://github.com/rm-hull/luma.examples/tree/main/examples
Hi Michael,
thank you for this great project.
Is there an option to show the disk space of my ZFS pool instead of the space of the SD Card of the system (I mean row 4)?
Greetings,
Andreas
Yes, you can modify your script to display the disk space of a ZFS pool instead of the boot drive. To achieve this, you’ll need to use the zpool command to retrieve the disk space details of your ZFS pool.
Something like this;
cmd = “zpool list -H -o name,size,alloc,free | awk ‘{printf \”%s: %s/%s Used\”, $1, $3, $2}'”
ZFSSpace = subprocess.check_output(cmd, shell=True).decode(‘utf-8’).strip()
draw.text((0, 48), ZFSSpace, font=font, fill=255)
And this I will change in stats.py?
This is great thanks Michael.
Hello! I see that you installed the Blinka library using a github link, is there any difference by installing it by pip(adafruit-blinka)?
Thanks for posting this guide, was very easy to follow as a beginner to linux and pi OS!
While the display worked on initial setup, I am currently having two issues upon reboot:
1.) I cannot change to the monitor. py script, even though I changed the OLED_display file to:
#!/bin/bash
source stats_env/bin/activate
cd OLED_Stats
python3 monitor.py
2.) If I manually cd into the OLED_Stats folder and try to run “python3 stats.py” or “python3 monitor.py” I get an error in line 6 “import board” that reads “ModuleNotFoundError: No module named ‘board'”
Hello! Great! But where can i find all the available icon images?
Hello! Great! But where can i find all the available icon images?
ello, very interesting article, everything finally worked for me except that the display does not turn on after restarting the PI, but I also have one question. I installed Windows 11 on the RPI 5 and it works. Will this display/stats program also work under Win 11? And if not, is it possible to run it under Windows 11 on the RPI 5? Best regards, Jerzy
When I run the command on a Raspberry Zero 2W,
I get this error:
Blinka error: subprocess-exited-with-error
python setup.py egg_info did not run successfully
…
…
note: This error originates from a subprocess, and is likely not a problem with pip.
Blinka error: metadata-generation-failed
Could you help me solve this?
Thanks
When I run the command on a Raspberry Zero 2W,
command: sudo -E env PATH=$PATH python3 raspi-blinka.py
I get this error:
Blinka error: subprocess-exited-with-error
python setup.py egg_info did not run successfully
…
…
note: This error originates from a subprocess, and is likely not a problem with pip.
Blinka error: metadata-generation-failed
Could you help me solve this?
Thanks
Question
My Crontab won’t execute the OLEDdisplay script if there is a power cut and the device fully powers off. How would I best change this example to run the command script to show stats on the OLED display from a cold boot.
For older Raspberry Pi (mine is a Model 1B Rev0002):
sudo i2cdetect -y 1 did not work, use sudo i2cdetect -y 0 instead.
Additionally, I had to do a “sudo apt-get install python3-rpi.gpio” before it the OLED libraries worked.
Hi Michael – Im in the middle of building your Lab Rax NAS mod for the PI5 and Radxa hat – how do you access the gpio pins after the hat is installed for this? Sorry if ive missed this somewhere – I watch all your content and dont remember seeing that part come up, but you have obviously done it – can you point me to video or other resource? Thank you!
Just seen that there is an expansion interface on the hat – sorry for adding another question to the hundreds you must get but think I got this one.
And the answer was ” Solder to the tops of the gpio pins” – I watched again and you very clearly showed that. Thanks for the tutorial , working no problem with OMV. Now i just need to find a way to switch the display off and on to make it last as long as possible. Probably would not have messed with this at all if i had known those displays only lasted a few months with 24/7 use…